Change Risk Dashboard (IP)
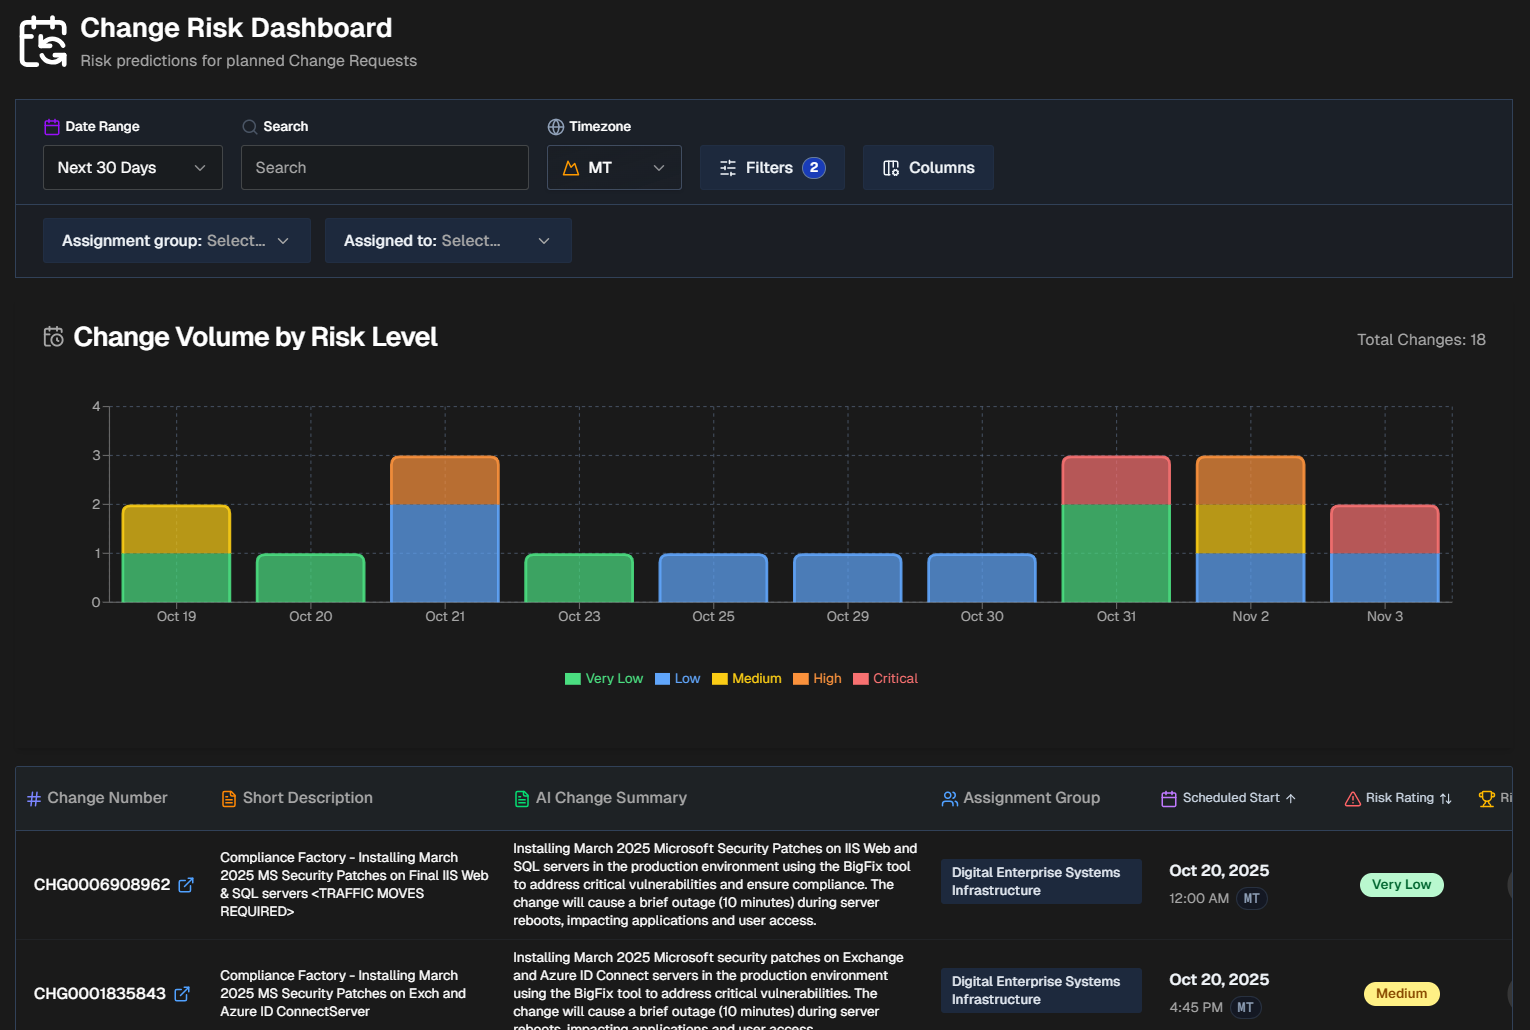
Within the Change Risk Dashboard, view all change requests and their associated risk, predicted by AI Incident Prevention.
Risk score rating frequency
The Change Risk Dashboard assigns a risk score to upcoming changes. The risk score is based on specific change fields and compares the current planned change details with data from your change integrations to identify potential risks.
Changes are typically risk rated every 25-35 minutes, but can take up to an hour depending on the number of changes queued. To request an ad-hoc risk rating, use the Change Risk Analysis API.
The Change Risk Dashboard is divided into three tabs:
Risk Prediction
The Risk Prediction tab displays upcoming change requests and their associated risks.
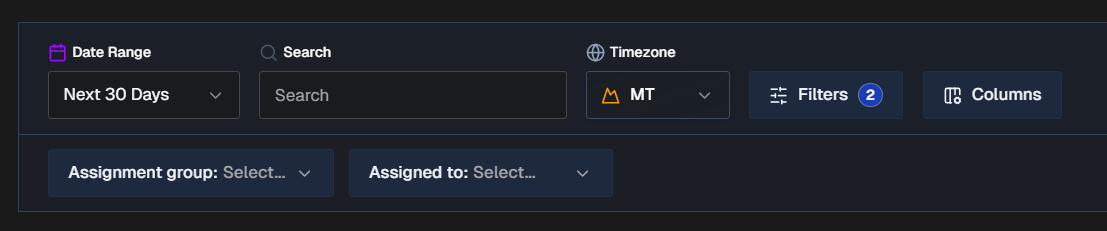
By default, all changes for the next 30 days appear in the Risk Prediction tab. You can filter the list using Risk Profiles, Date Range, Time Zone, or click Filters to select one or more ServiceNow fields to filter on. Selected ServiceNow fields will appear as dropdowns in the bar below where you can choose specific values.
To find a specific change, use the Search bar. You can search for a change number or keyword.
Click Columns to customize the columns that appear in the changes table. You can choose from default columns, or select ServiceNow fields. Reorder columns by dragging and dropping them.
The following columns appear in the Change Risk table by default:
Change number
Short description
AI Change Summary (Full description)
Assignment group
Scheduled start
Risk rating
Risk score
Filter and column persistence
All filters and column selections persist on a user-level basis. Your selections will not affect other users' view of the dashboard.
When you exit the dashboard or web app, your selections will be retained and appear the next time you access the dashboard using your account.
Export CSV
To download the table, scroll to the bottom of the page and select Export CSV. The exported CSV file contains the following columns:
Change Number
Short Description
AI Change Summary
Assignment Group
Scheduled Start
Risk Rating
Risk Score
Last Assessed
Risk Reasoning
Suggested Mitigations
Change Volume by Risk Level
Below the filters and search bar is the Change Volume by Risk Level graph. This displays the total number of changes over time broken down by risk level.
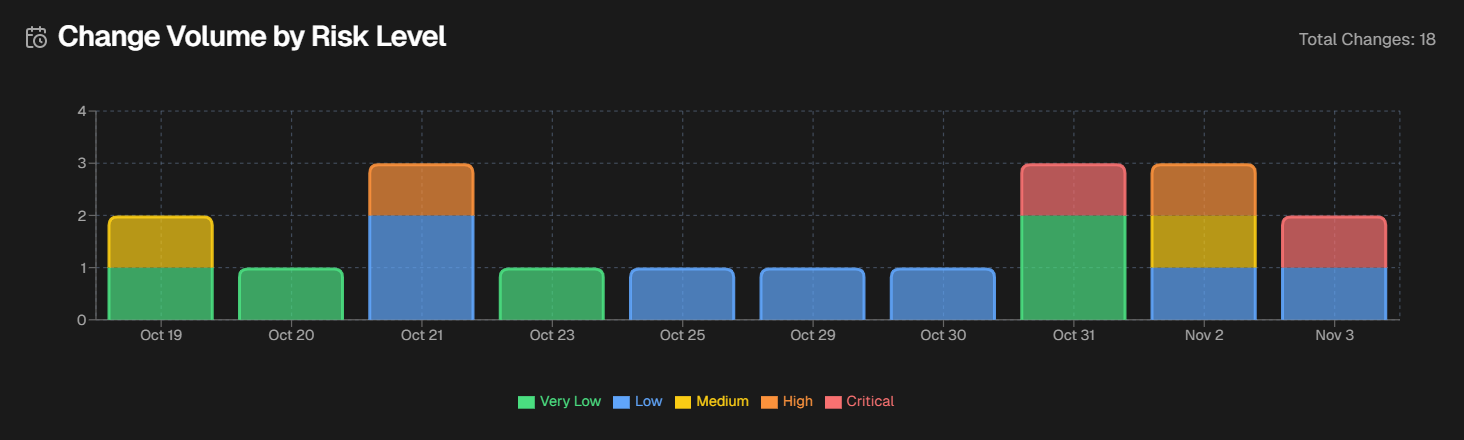
Hover over a specific day to see the numer of changes in each risk level that occurred on that day.
Change Risk Assessment
Click any change in the dashboard to open the Change Risk Assessment screen.
The Change Risk Assessment screen shows you details about the potential risk associated with the selected change.
The assessment screen is divided into the following tabs:
To send an assessment to an external system, go to the upper right corner of the screen and click the Arrow icon. Assessments can be sent to Email, Slack, MS Teams, or ServiceNow.
File analysis
AI Incident Prevention can analyze files attached to change tasks. Supported file types include pdf, csv, xlsx, xls, txt, doc, docx, msg.
Change Details
The Change Details tab displays high-level information about the selected change.
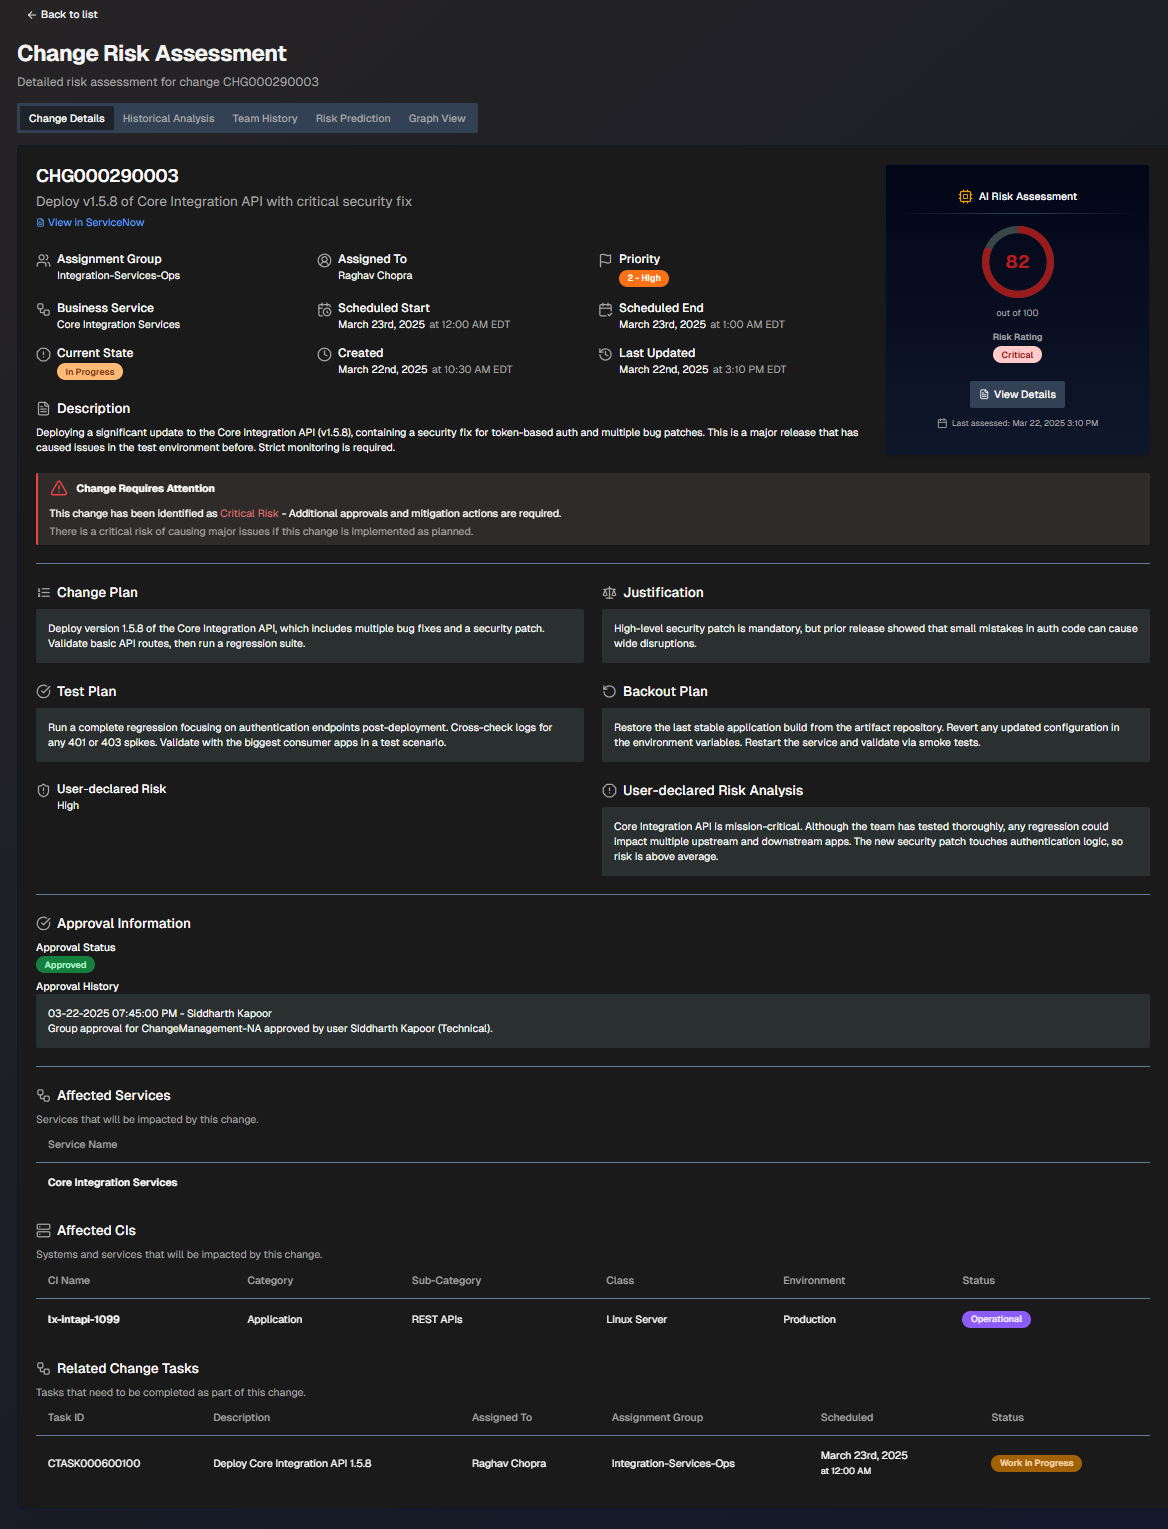
To adjust which ServiceNow fields appear on the screen, select Display Settings. Choose additional fields and click Apply Changes.
The screen is divided into the following sections:
Section | Description |
|---|---|
Change Information | High-level information about the change. The following details are displayed in this section:
If the change requires attention, a red box with an exclamation point will appear describing the requirements. |
AI Risk Assessment | The risk assessment score and risk rating. Click View Details to open the Risk Prediction tab. |
Change Plan | Steps to take to implement the change. |
Justification | Reasoning behind the change plan. |
Test Plan | Steps to take to test after the change to ensure it was successful. |
Backout Plan | Steps that can be taken if the change needs to be reversed. |
User-Declared Risk | The risk level of the change defined by the user who opened it. |
User-Declared Risk Analysis | The risk analysis of the change defined by the user who opened it. |
Approval Information | People who need to review the change before it can be implemented. The following information about each approver is displayed:
|
Affected Services | Services potentially affected by the change. |
Affected CIs | Systems and services that will potentially be affected by this change. The following information about each CI is displayed:
|
Related Change Tasks | Tasks that need to be completed as part of the change. The following information about each task is displayed:
|
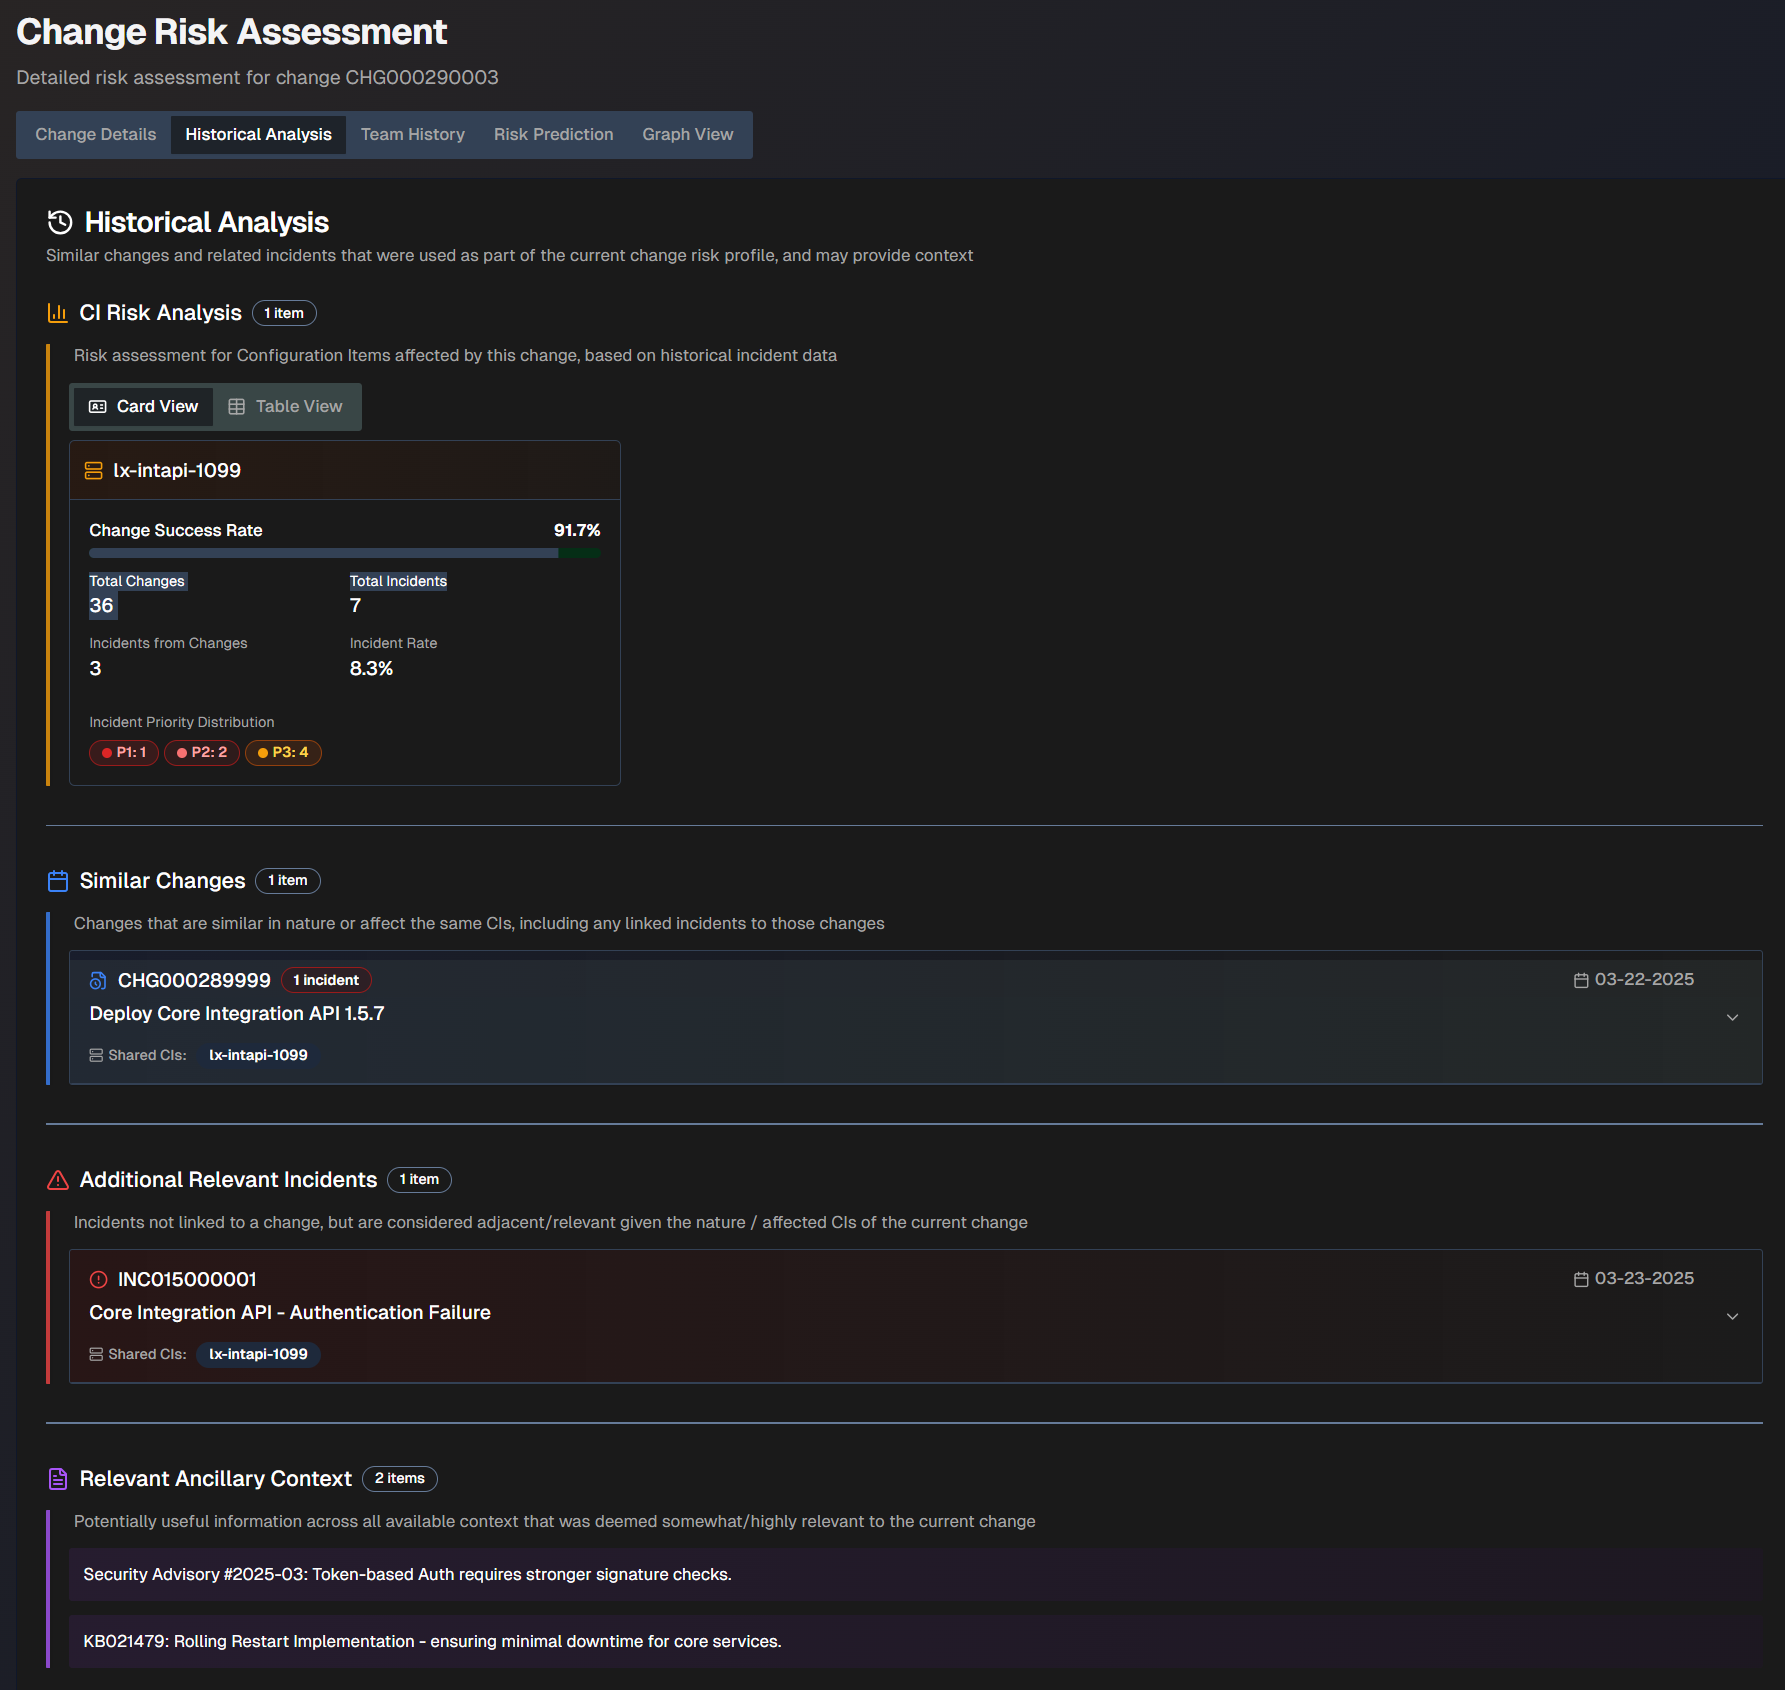
Historical Analysis
The Historical Analysis tab displays similar changes and related incidents that were used as part of the change risk profile. These changes and incidents may provide additional context.
The Historical Analysis screen is divided into the following sections:
Section | Description |
|---|---|
CI Risk Analysis | The risk assessment for configuration items affected by this change, based on historical incident data. This information can be displayed in Card View or Table View. The following information appears for each CI:
|
Similar Changes | Changes that are similar in nature or affect the same CIs. A box displaying the change number, description, and date appears for each similar change. Click a box to view additional information including the full description, similarity reasoning, resolution of the incident (if applicable), and linked incidents. |
Additional Relevant Incidents | Incidents that were not linked to a change, but are considered relevant given the nature or affected CIs of the current change. A box displaying the incident number, description, date, and shared CIs appears for each relevant incident. Click a box to view additional information including the full description, similarity reasoning, and resolution of the incident (if applicable). |
Relevant Ancillary Context | Information across all available contexts that was deemed potentially relevant to the current change. |
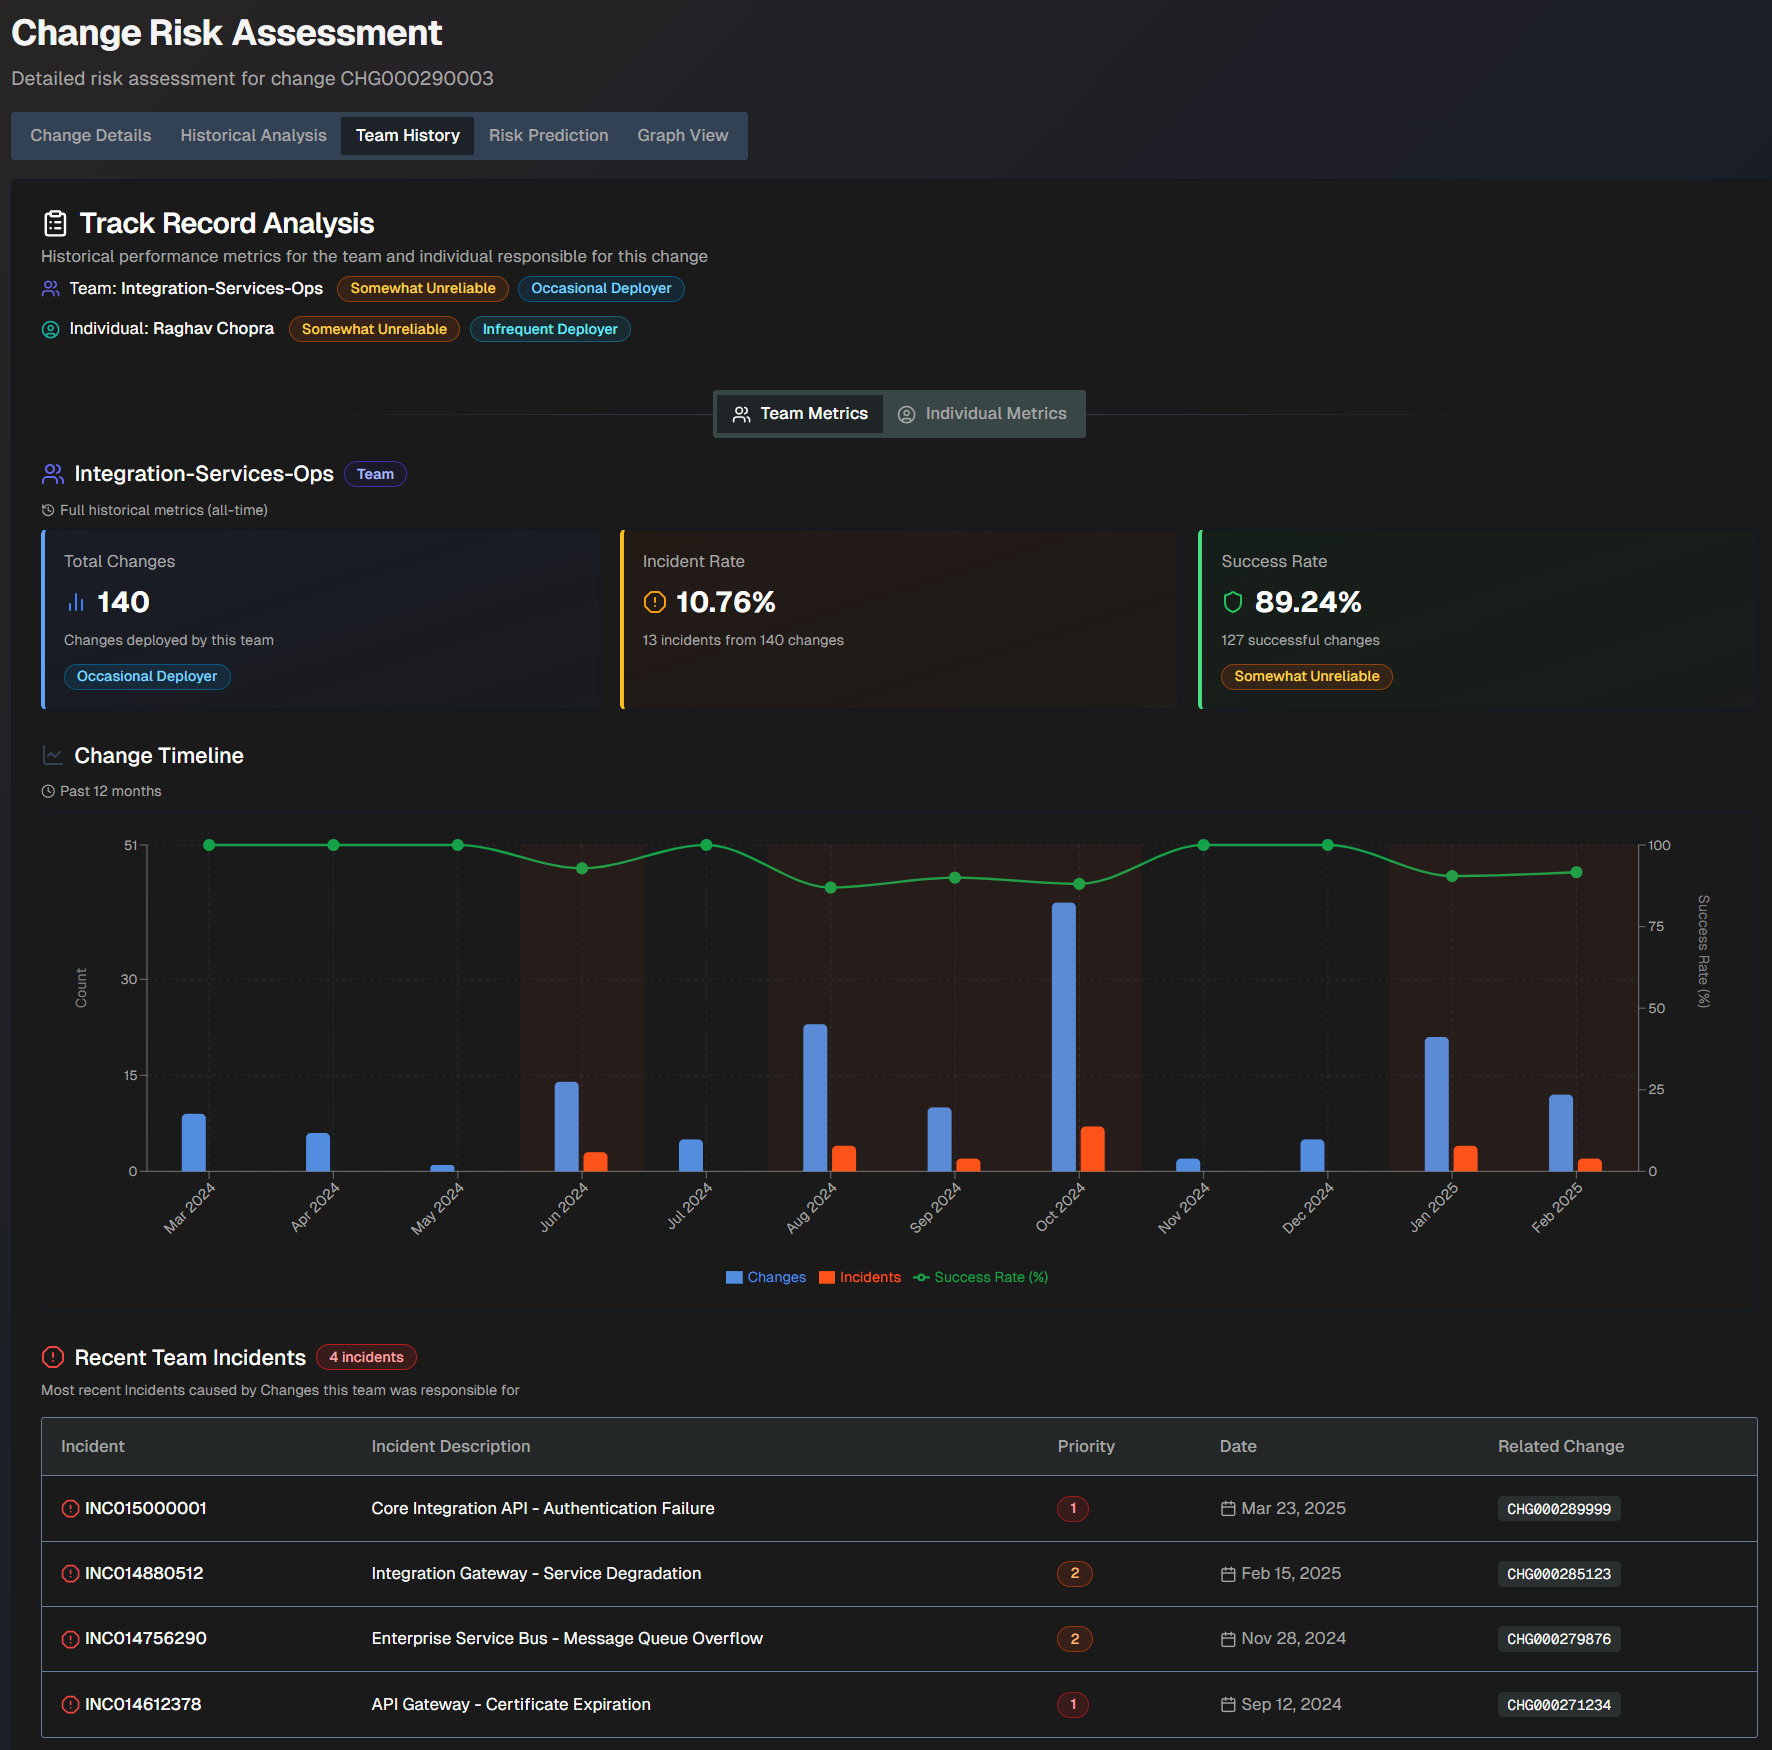
Team History
The Team History tab shows the historical performance records of the team and the individual responsible for the change.
You can view history by Team Metrics or Individual Metrics.
The Team History screen shows the following information:
Field | Description |
|---|---|
Team | The team name, reliability score, and deployment frequency score. |
Individual | The individual's name, reliability score, and deployment frequency score. |
Total Changes | The total number of changes deployed by the team. This number is based on full historical metrics. |
Incident Rate | The incident rate compared to the number of changes the team was responsible for. This rate is based on full historical metrics. For example, if the team was responsible for 10 changes and 2 of them caused incidents, the incident rate would be 80%. |
Success Rate | The percent of successful changes that the team was responsible for. This rate is based on full historical metrics. For example, if the team was responsible for 10 changes and 2 of them caused incidents, the success rate would be 80%. |
Change Timeline | A timeline of changes over the past 12 months. The blue bars represent changes, the orange bars represent incidents, and the green line represents the change success rate. |
Recent Team/Individual Incidents | The most recent incidents caused by changes the team or individual was responsible for. The following information about each incident is displayed:
|
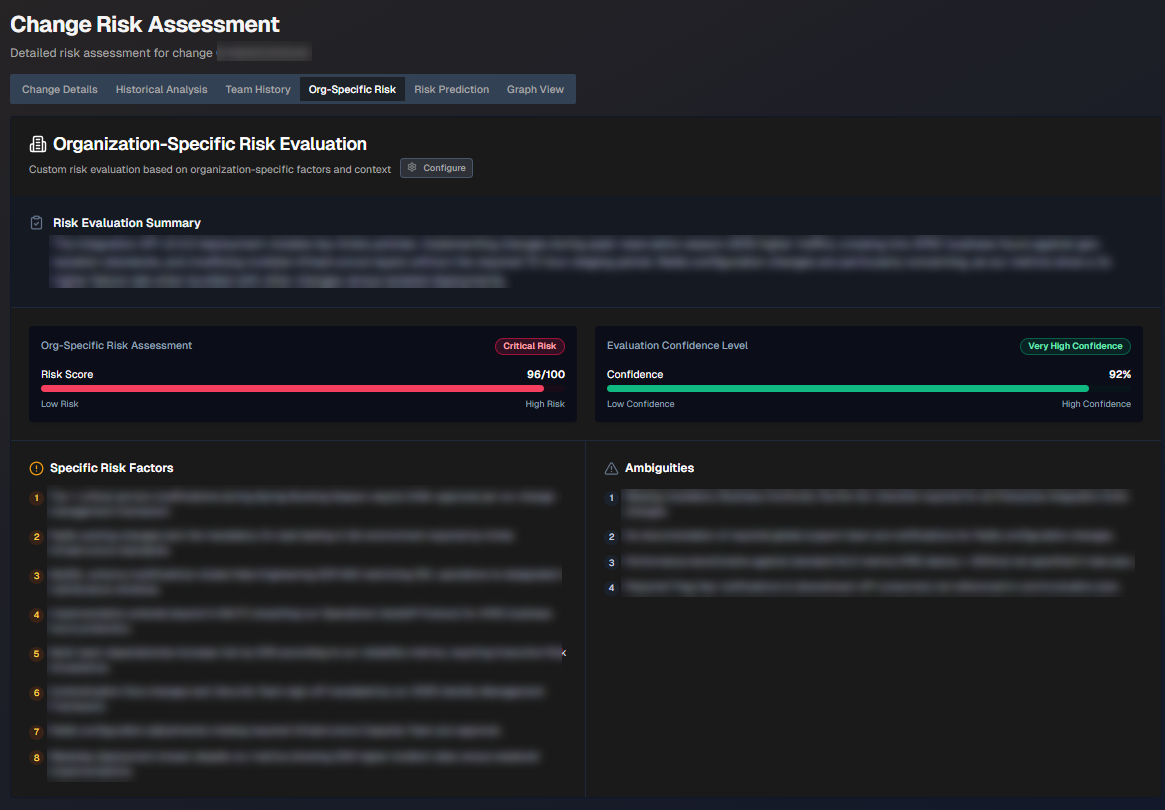
Organization-Specific Risk Evaluation
The Organization-Specific Risk Evaluation tab displays a custom risk evaluation based on factors and context specific to your organization.
Configuration
To view org-specific risk information, you must configure org-specific settings in the Change Risk Prediction action plan.
The following information is displayed:
Section | Description |
|---|---|
Risk Evaluation Summary | Short summary of the org-specific risk evaluation. |
Org-Specific Risk Assessment | The risk score. |
Evaluation Confidence Level | How confident AI Incident Prevention is in the evaluation. |
Specific Risk Factors | List of specific factors contributing to the risk score. |
Ambiguities | Ambiguous factors related to the change that contribute to the risk score. |
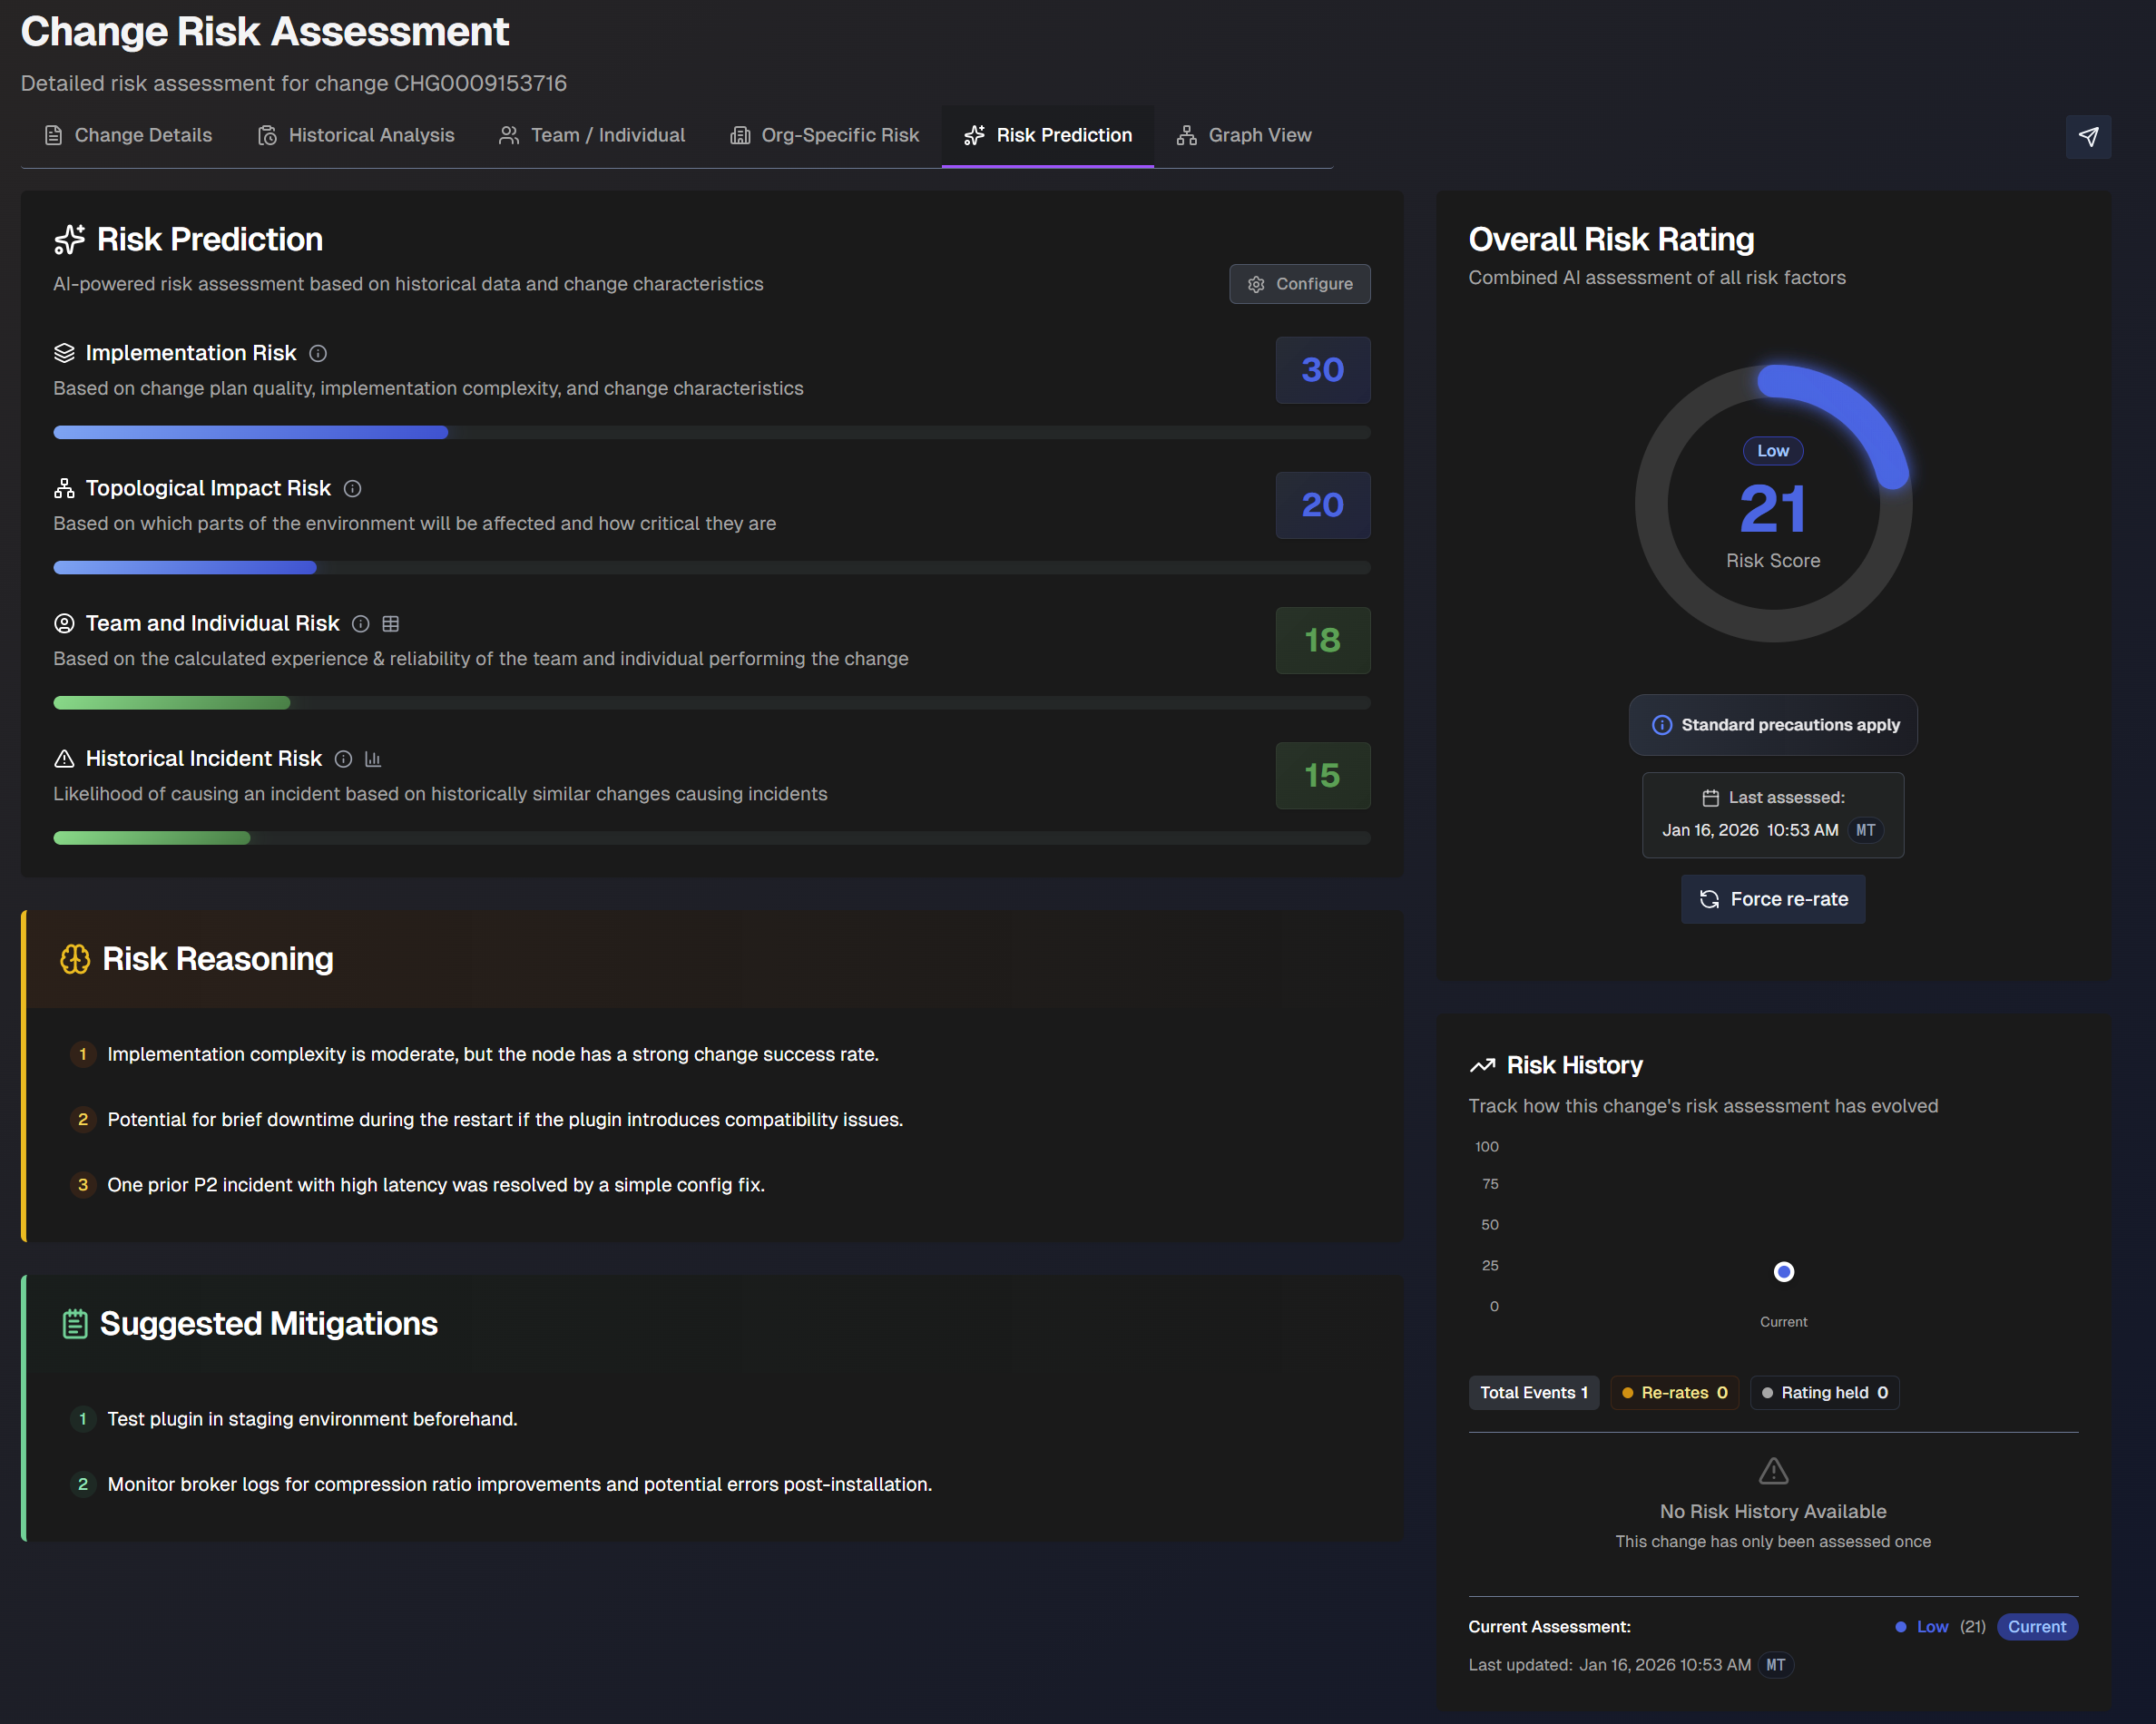
Risk Prediction
The Risk Prediction tab displays widgets containing information about the predicted risk level of the change.
The following widgets are displayed:
Widget | Description |
|---|---|
Risk Prediction | AI-powered risk assessment based on previous changes. The following scores are displayed:
|
Overall Risk Rating | The risk assessment of the change with all factors combined. The date and time of the last assessment appears under the risk rating. To re-assess the risk rating, click Force Re-Rate. |
Risk Reasoning | Explanation of the reasoning behind the risk assessment. |
Risk History | How the change's risk assessment has evolved over time. |
Suggested Mitigations | Suggested steps that can be taken to mitigate risks associated with the change. |
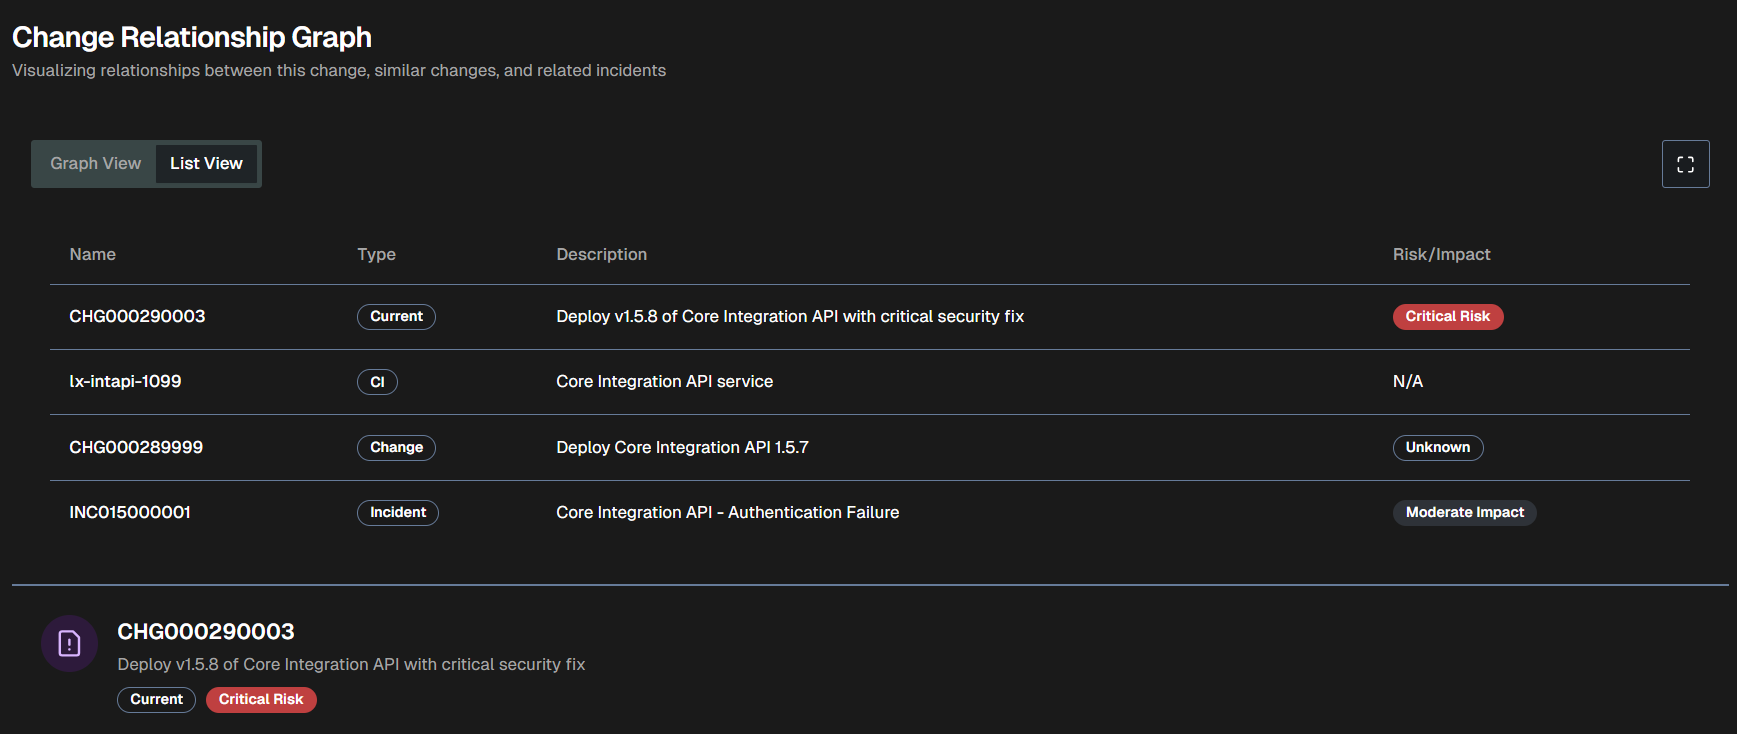
Graph View
The Graph View tab visualizes the relationships between the change, similar changes, and related incidents.
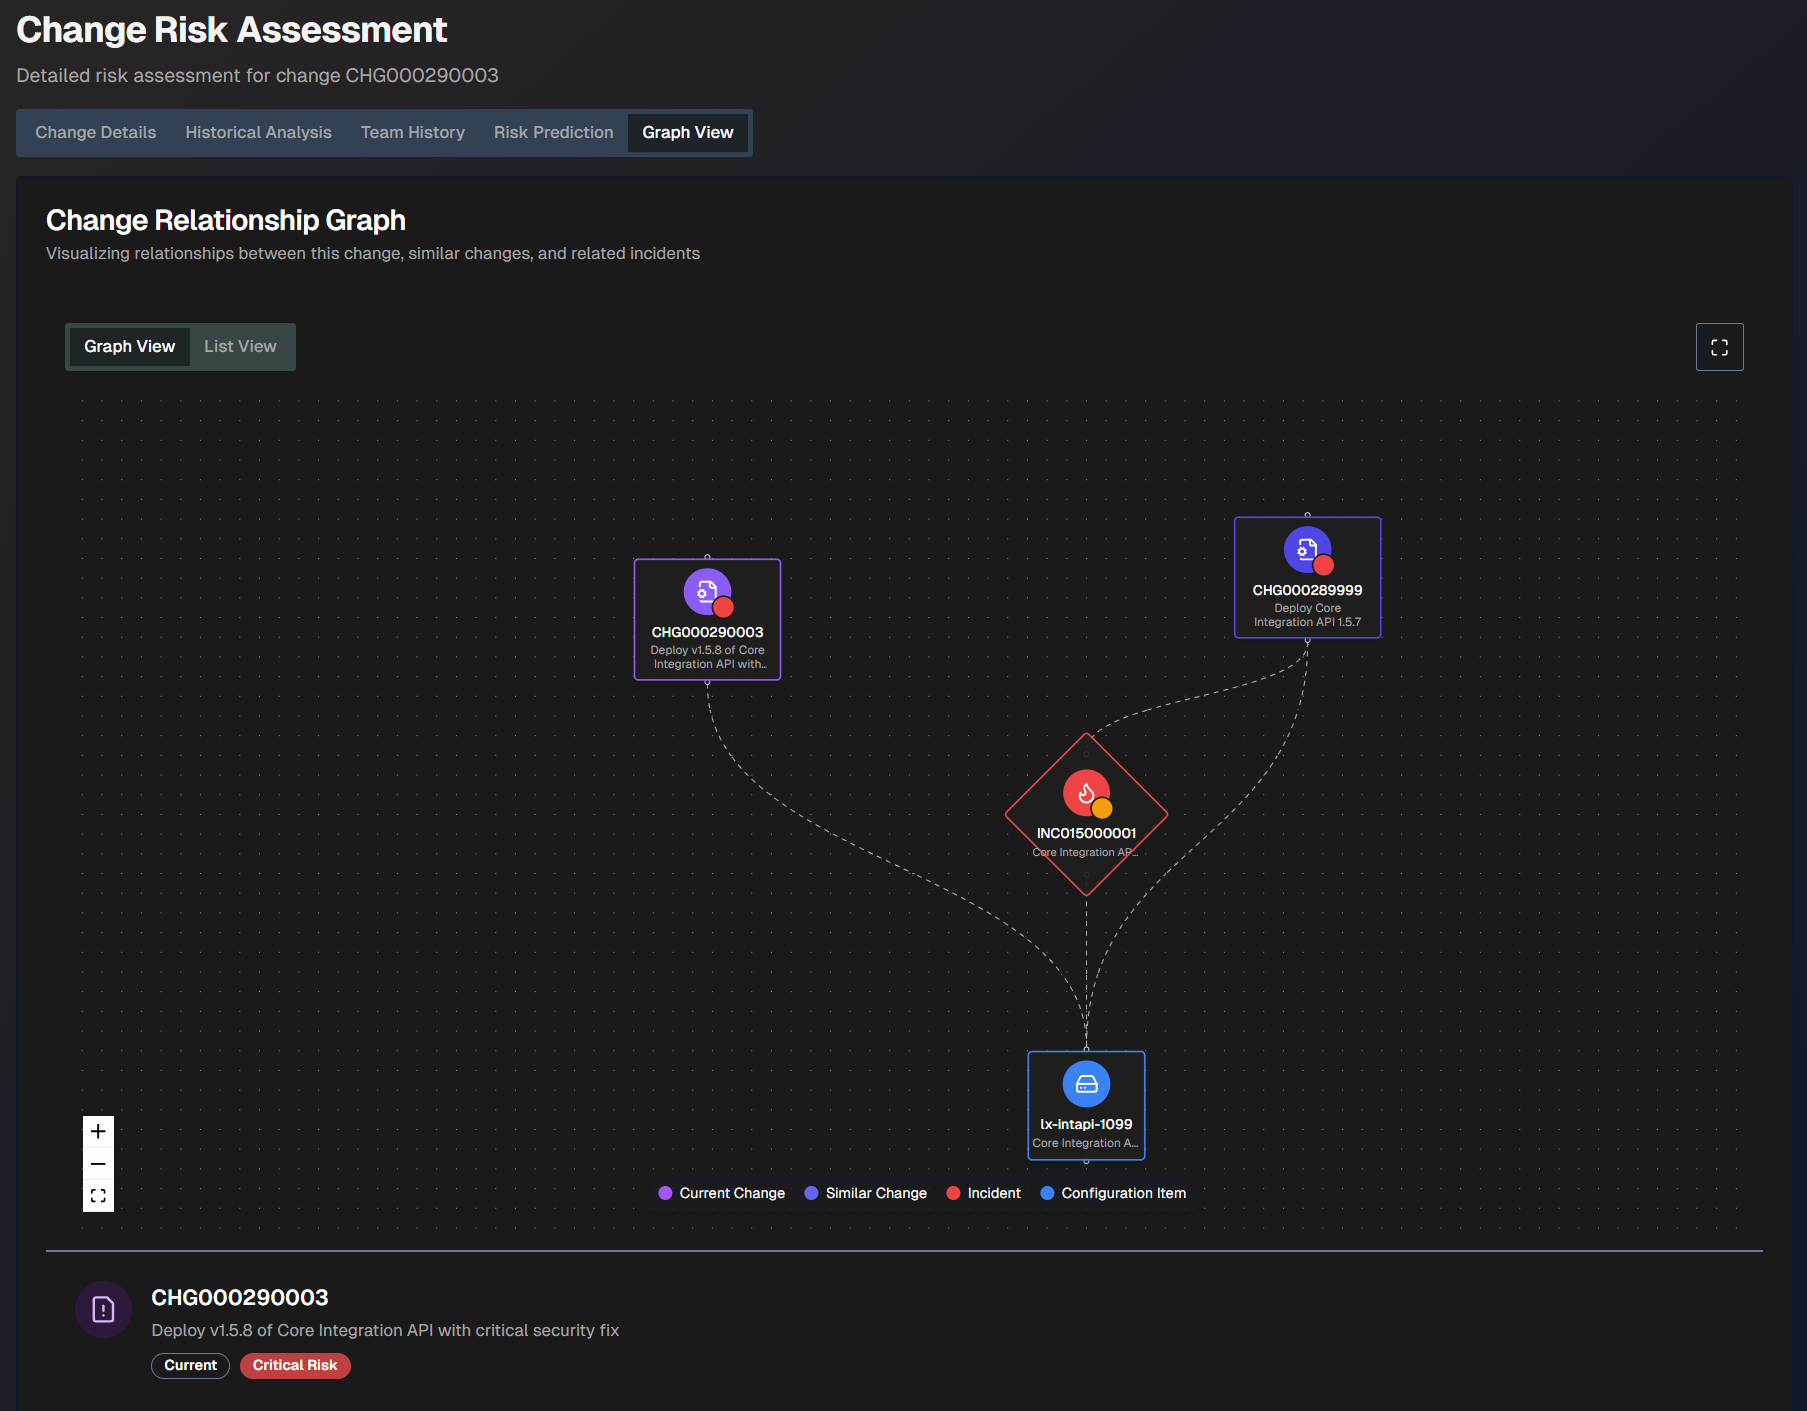
The graph view is coded by color:
Current change - purple
Similar change - purplish blue
Incident - red
Configuration item - blue
Hover over any of the items in the graph to view additional information such as the number, description, and risk level.
To see a larger view, click the Full screen button.
To view a text version of the visualization, click the List View tab.
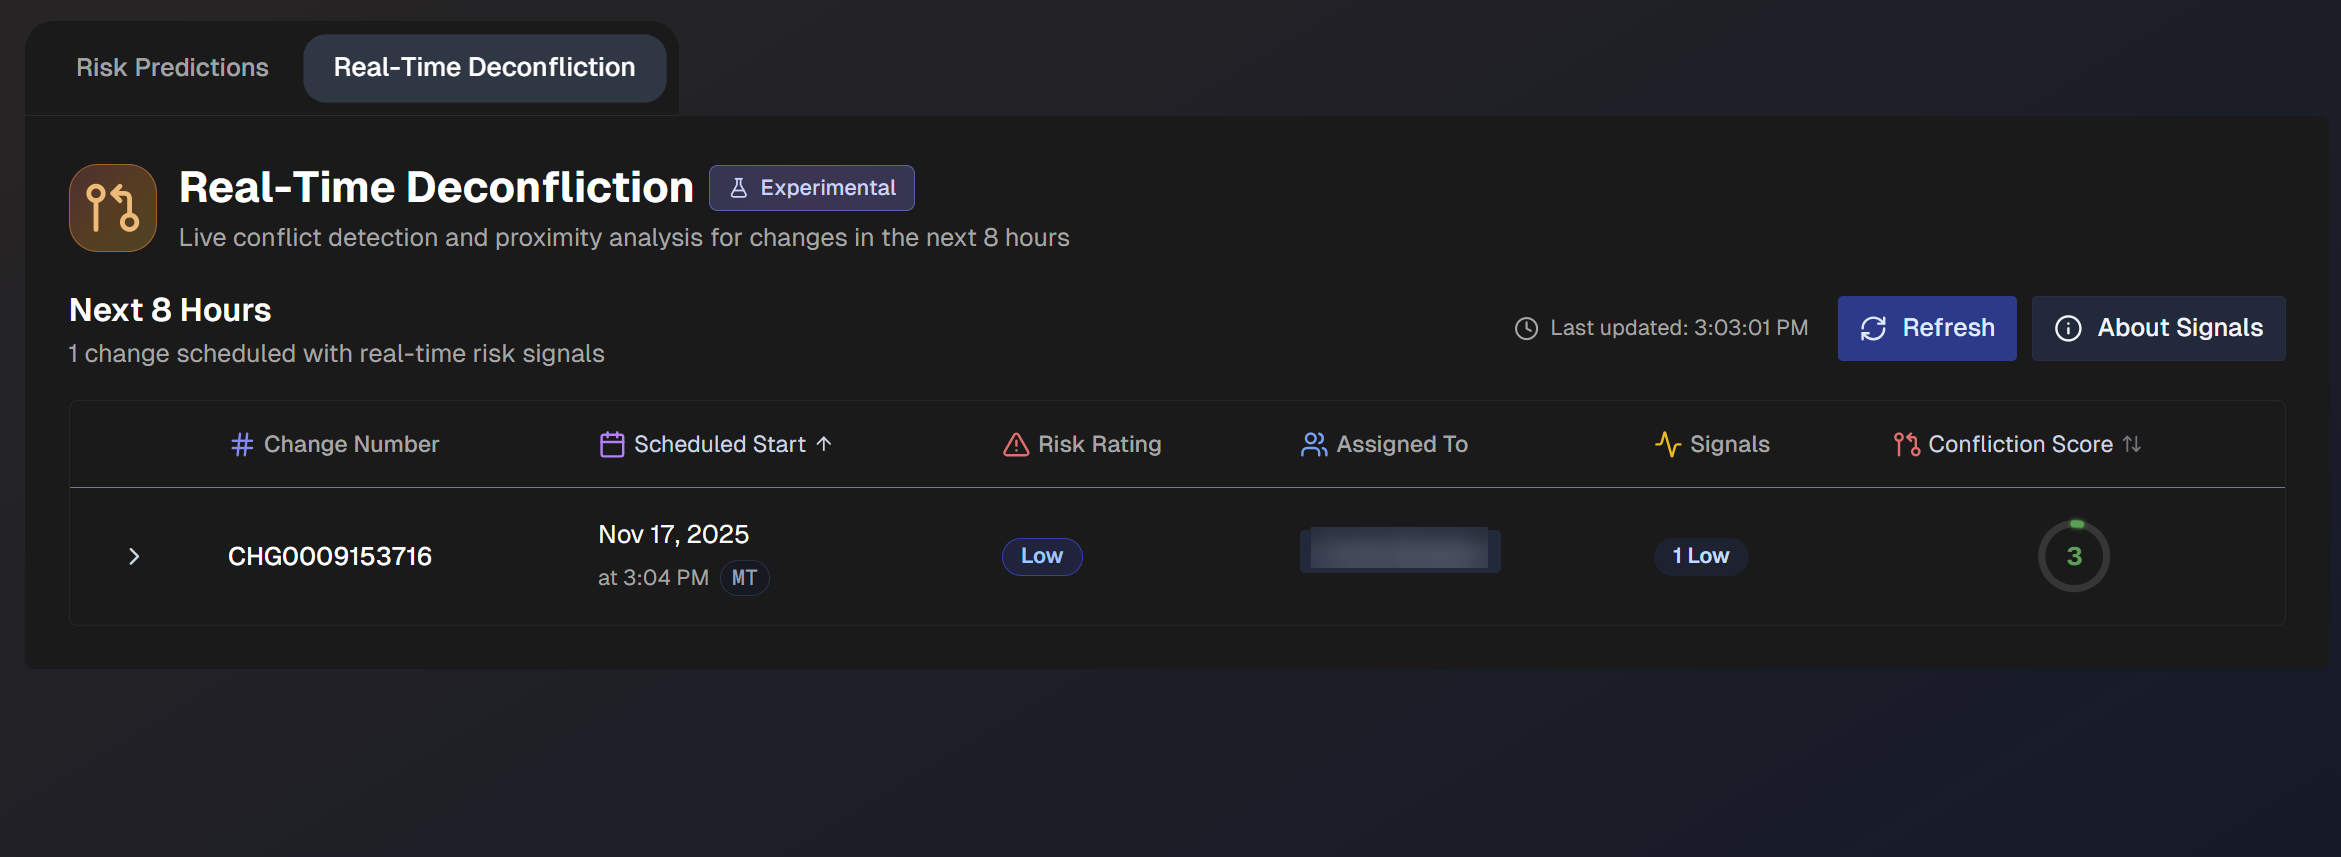
Real-Time Deconfliction
Use the Real-Time Deconfliction tab to identify conflict-based risks associated with upcoming changes.
By default, Real-Time Deconfliction displays data for the next 8 hours from all change risk profiles. You can filter the dashboard by Risk Profile or Time Range.
Real-Time Deconfliction Signals
AI Incident Prevention analyzes several different incident and change events to look for signals of conflict-based risks. The types of possible signals are:
Active incidents - Open incidents related to affected CIs or business services.
Recent incidents - Incidents resolved in the past 48 hours that may indicate instability.
Change conflicts - Changes affecting the same owner or CIs scheduled near the same time
Failed changes - Changes failed on the same CIs over the past 30 days.
Open problems - Active problem tickets related to affected CIs or business service.
Conflict risk rating is determined by the conflict type and timing proximity:
Conflict type | Overlapping (Concurrent) | Within 4 hours (Near) | Same day (Within 24 hours) |
|---|---|---|---|
Same CI (different owners) | Critical | High | Medium |
Same owner and same CI | High | Medium | Low |
Same owner only | Medium | Low | High |
Signal refresh
When you open the Real-Time Awareness tab, signals are refreshed and then cached for the session. You can also use the Refresh button at the top of the page to manually refresh.
Each signal includes detailed metadata and links to ServiceNow records when available.
Change Information
If a change has one or more real-time risk signals, it will appear on the dashboard. Each of these changes lists the following details:
Field | Description |
|---|---|
Change Number | Unique identifier of the change. |
Scheduled Start | Date and time when the change is scheduled to begin. |
Risk Rating | Projected risk level associated with the change. |
Assigned To | Person to whom the change is assigned. |
Signals | Number of real-time signals identified that contributed to the risk rating. |
Confliction Score | Score associated with the conflict. Higher scores indicate more conflicts. The highest possible score is 100. |
Click any change in the list to view the Deconfliction Assessment.
Deconfliction Assessment
The Deconfliction Assessment displays conflict details to help you avoid any potential risks.
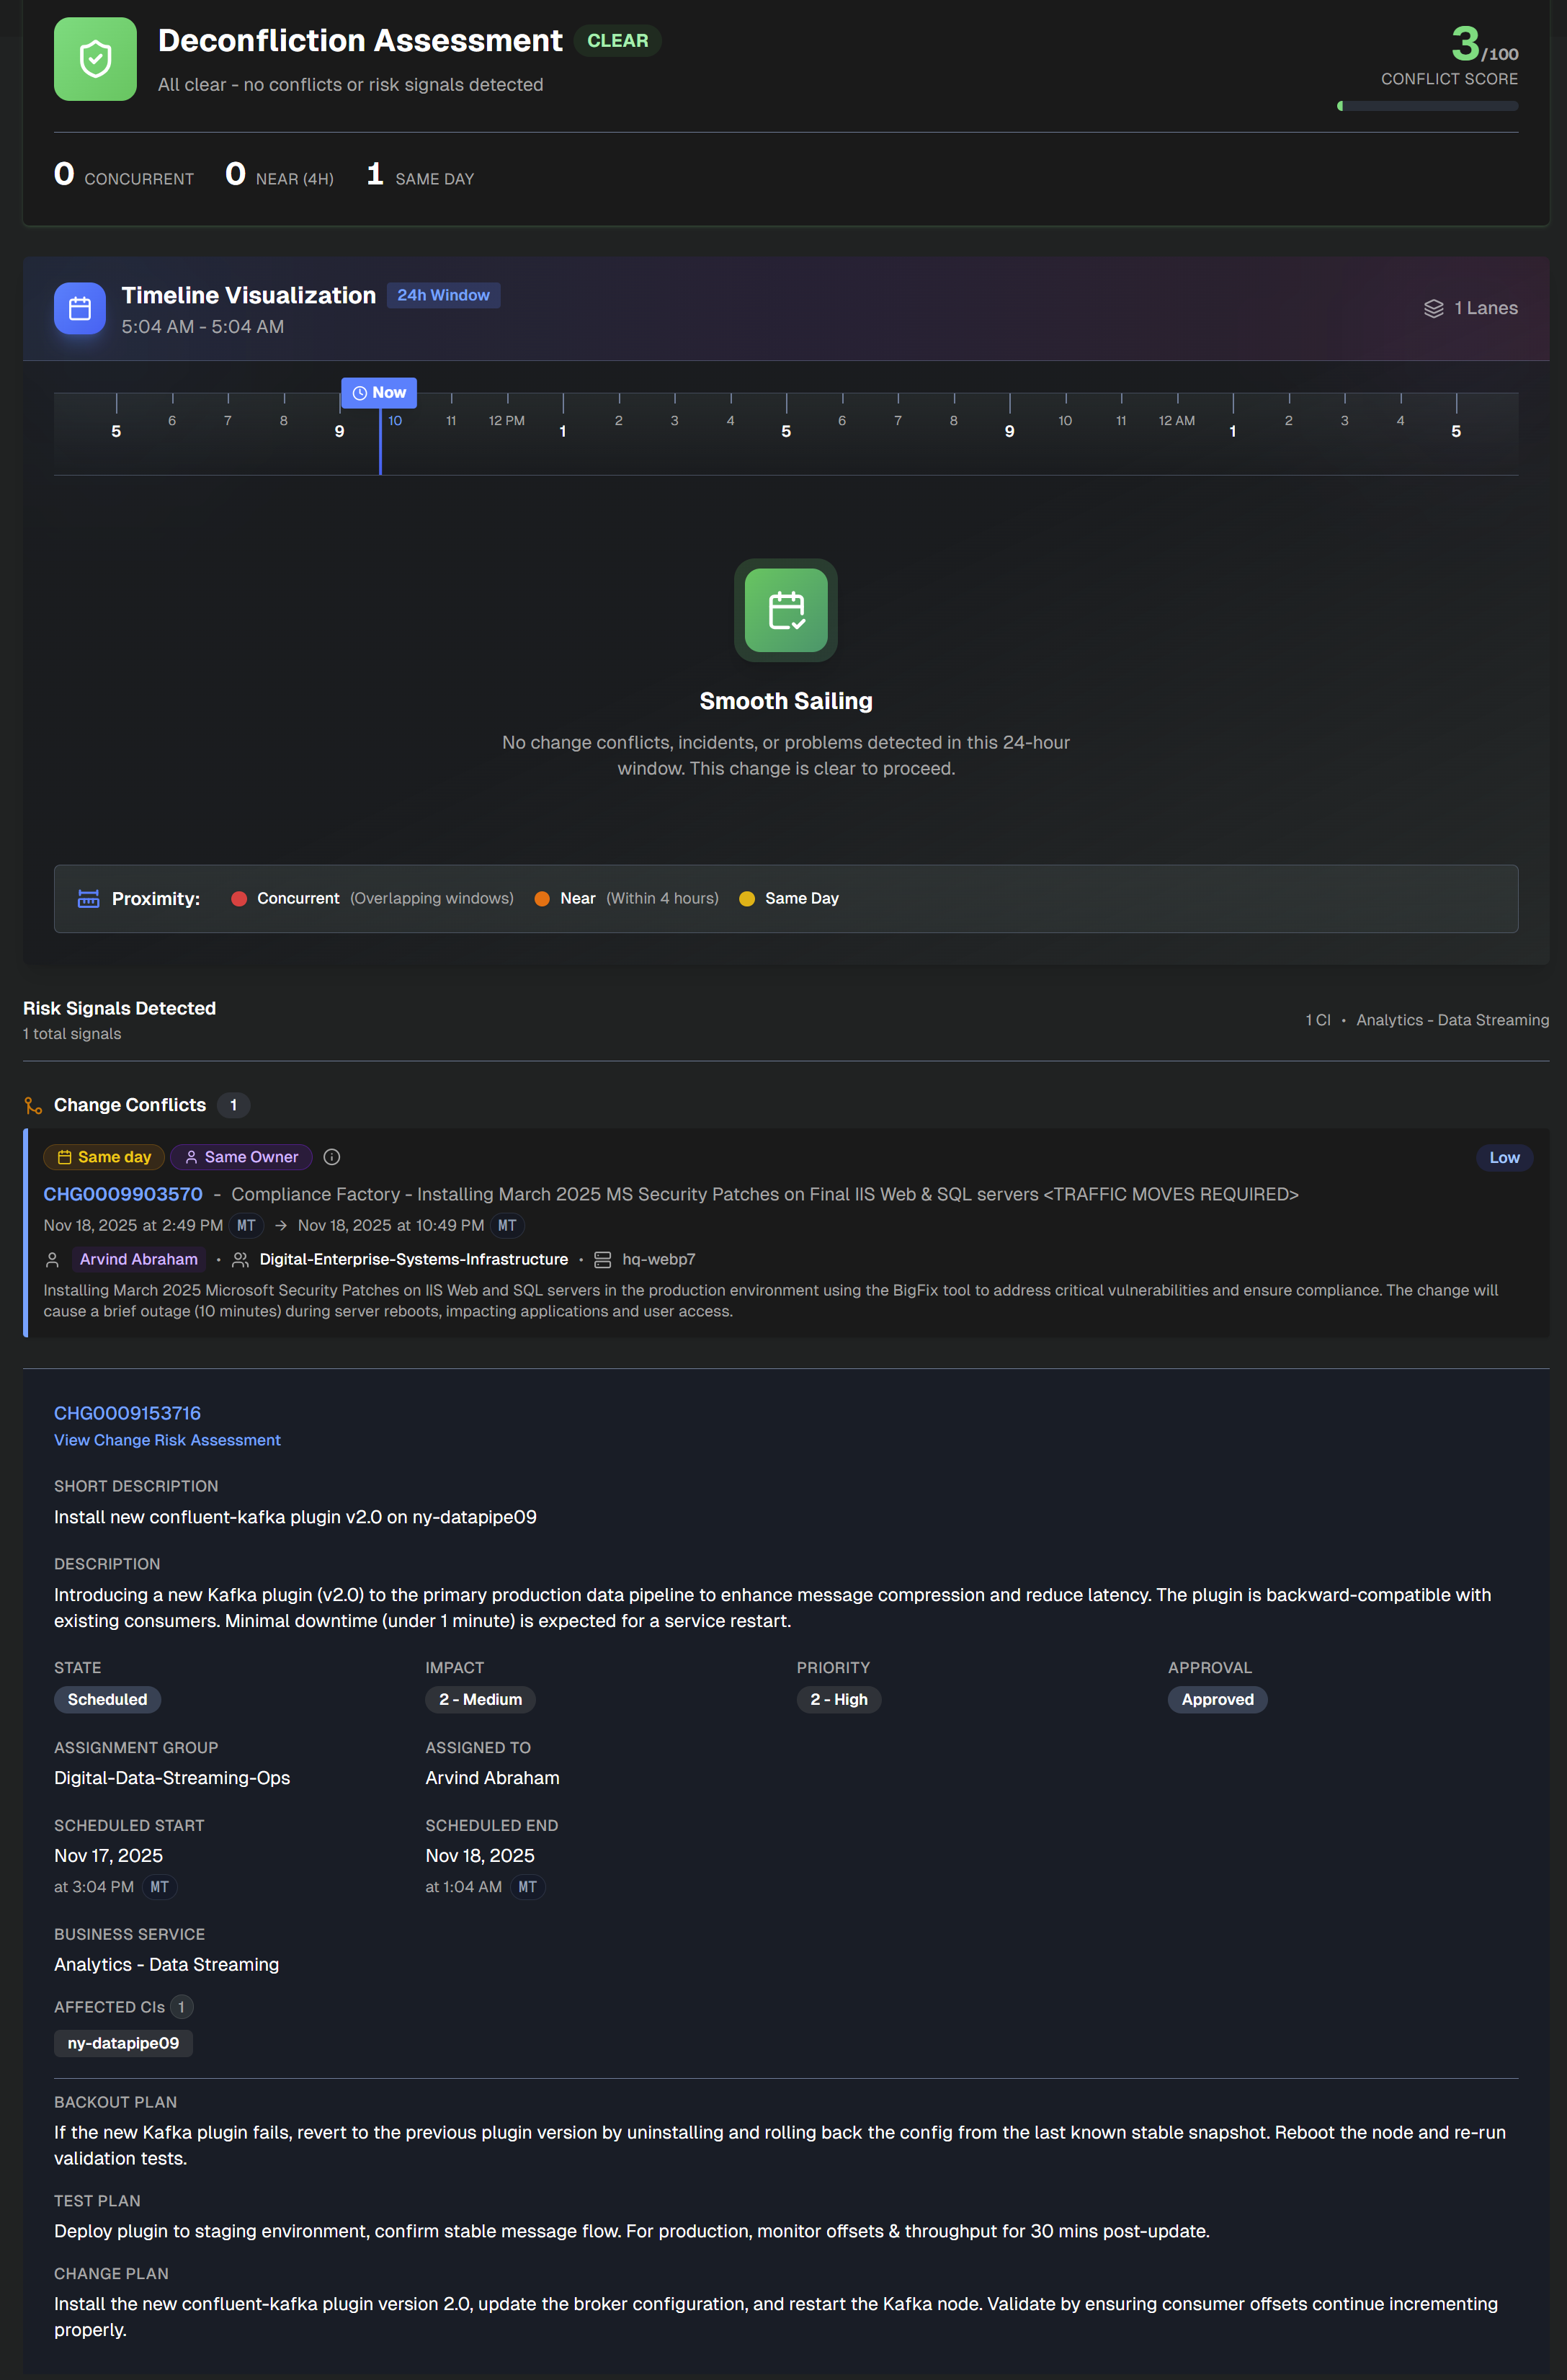
At the top left side of the assessment, the number of Concurrent, Near (within 4 hours), and Same Day changes appears. At the top right side, the Conflict Score is available.
The assessment is divided into the following sections:
Section | Description |
|---|---|
Timeline Visualization | Timeline of conflicting changes over the next 24 hours. Concurrent change windows are red, changes within 4 hours are orange, and same-day changes are yellow. |
Risk Signals Detected | Details about each of the risk signals that contributed to the conflict. Information such as signal type, conflict type, change proximity, and other details are displayed. |
Change Details | Information about the assessed change. Click the change number at the top of the section to open it in ServiceNow. Click the link below the change number to open the full change risk assessment. The Change Details section contains the following information:
|
CAB Report
Generate structured reports for Change Advisory Board meetings on the CAB Report tab.
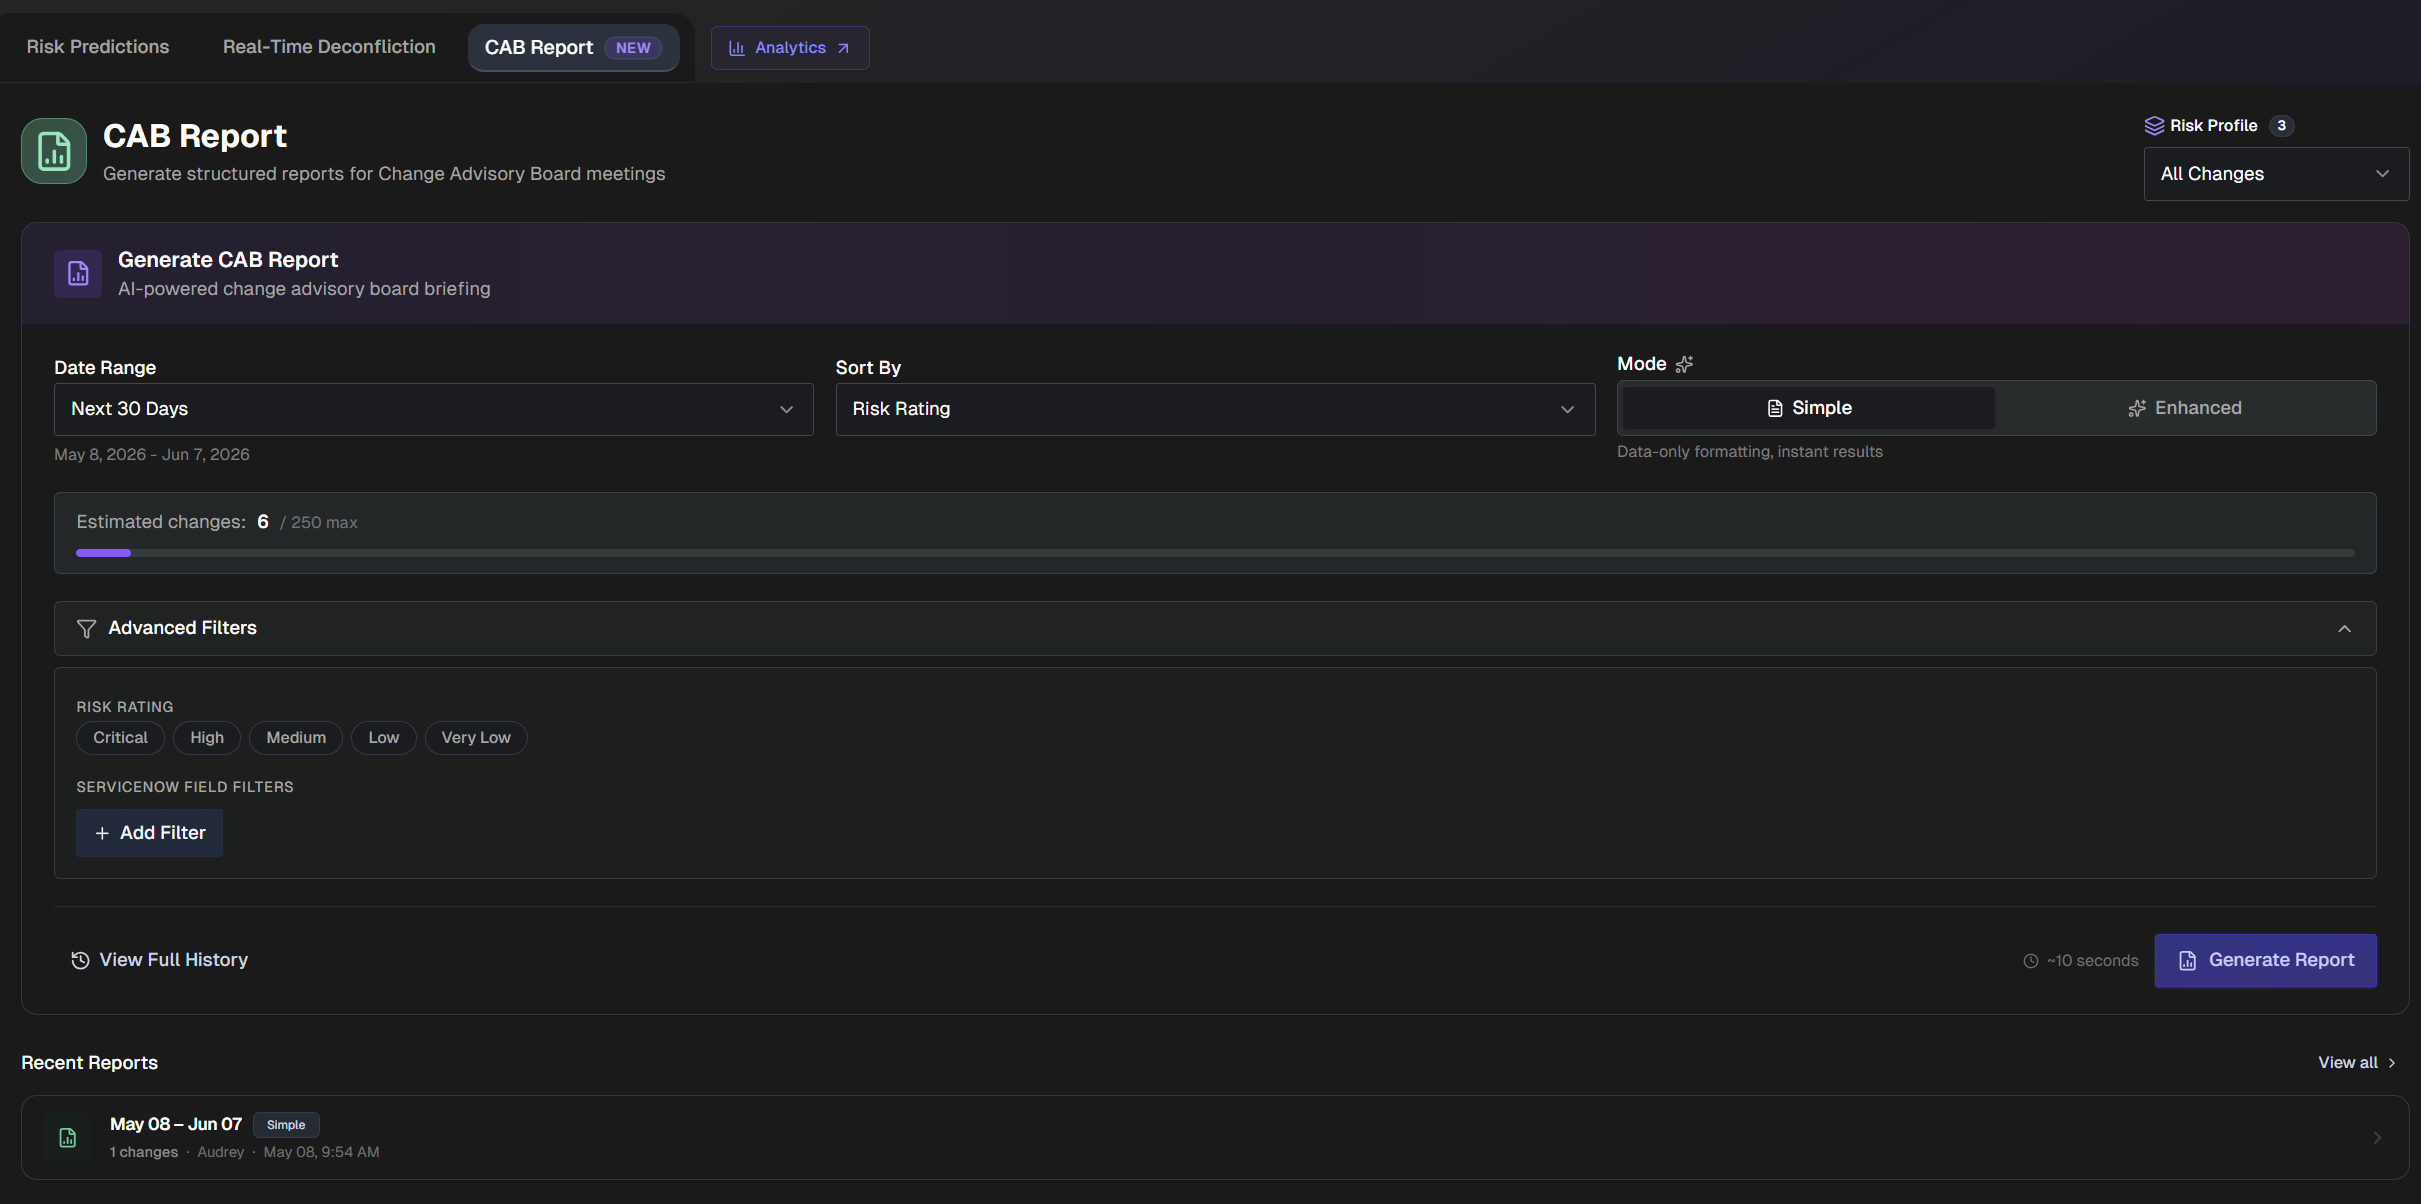
To generate a CAB report:
In the upper right corner of the page, select which Risk Profile you'd like to create a CAB report for
In the Generate CAB Report section, select a Date Range for the report.
Select how you would like to sort changes in the report. In the Sort By menu, select from Risk Rating, Scheduled Start, or Assignment Group.
Select the report Mode. The following options are available:
Simple - Formats your existing risk data into a structured CAB briefing. Provides instant results.
Enhanced - AI analyzes each change for talking points, recommendations, and cross-change patterns.
(Optional) Under Advanced Filters, you can add additional filters to the report. The following options are available:
Risk Rating - Filter by one or more risk levels.
ServiceNow Field - Filter by ServiceNow fields.
Click +Add Filter to select one or more fields. Select Apply Selection to add the filter(s). Selected fields will appear as dropdowns under Advanced Filters, where you can choose specific values.
Click Generate Report to create the report.
View a CAB Report
After clicking Generate Report, it automatically opens.
You can also access previously generated reports on the main CAB Report tab by selecting View Full History. Recent Reports also appear at the bottom of the page.
CAB Report Actions
At the top right of the report, you can take action on the report.
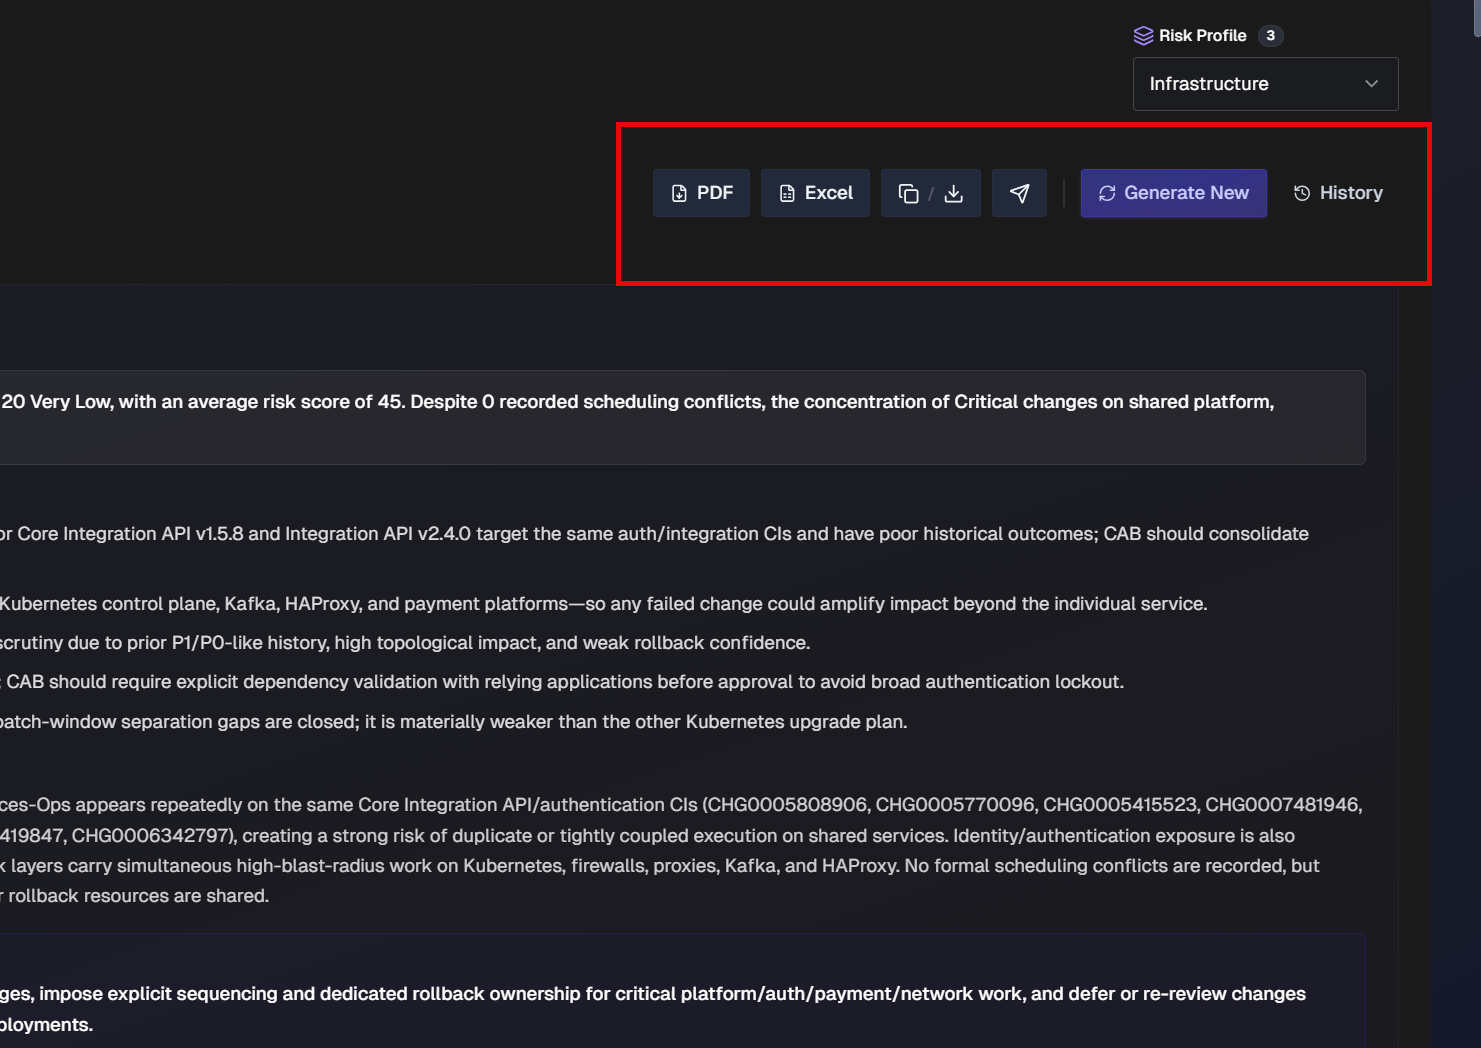
Click PDF or Excel to download the report as one of those two formats. Click Download to select other formats. Available file formats include PDF, Excel, Word, Markdown, or Text.
Click the Copy icon to copy the report. You can copy the report as Markdown, Text, or formatted for Google Docs.
Click the Share icon to send the report externally. You can send the report to Email, Slack, MS Teams, or ServiceNow.
Click Generate New to generate a new report based on the same criteria.
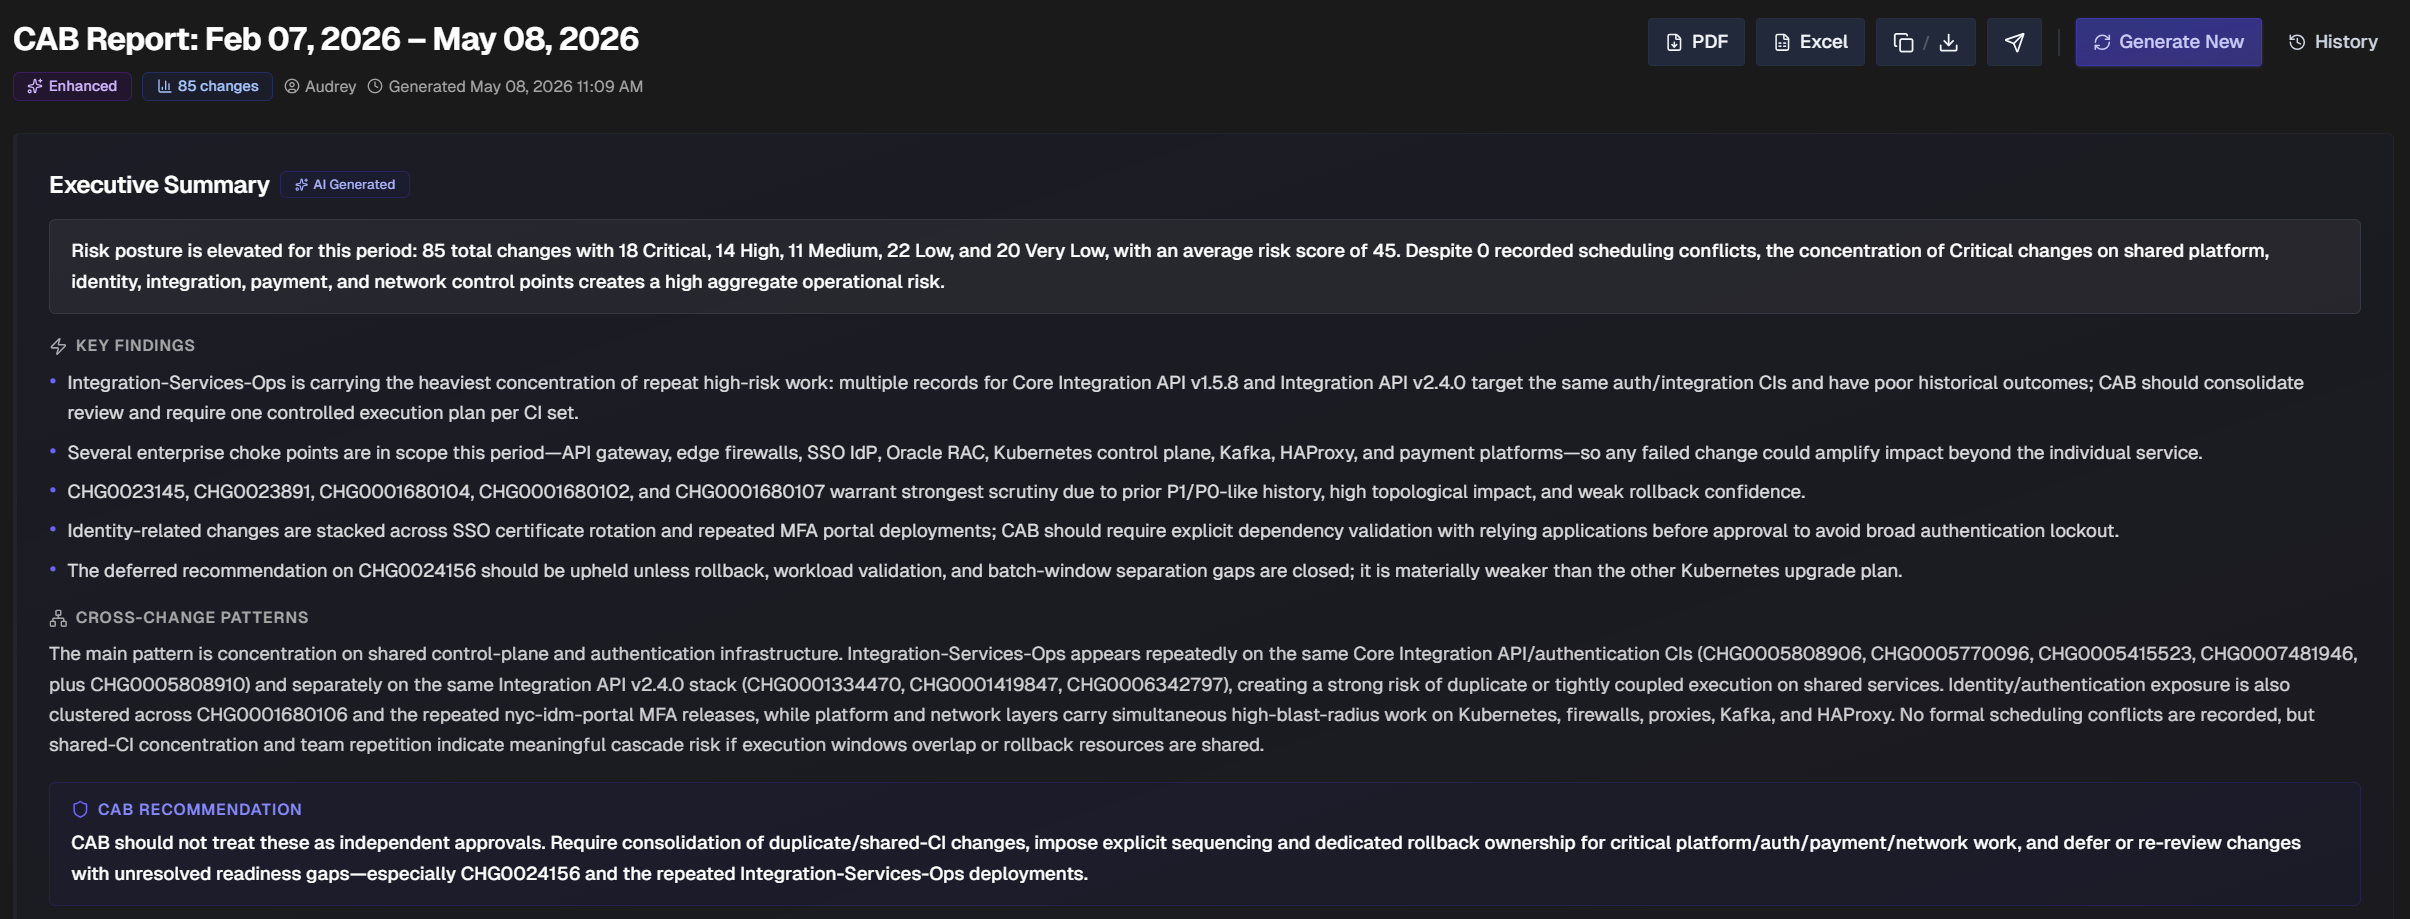
CAB Report Content
At the top of the report, the report title displays the date range covered (for example, CAB Report: May 08, 2026 – Jun 07, 2026). Below the title, you can see the report mode (Simple or Enhanced), the number of changes included, the user who generated the report, and the date and time the report was generated.
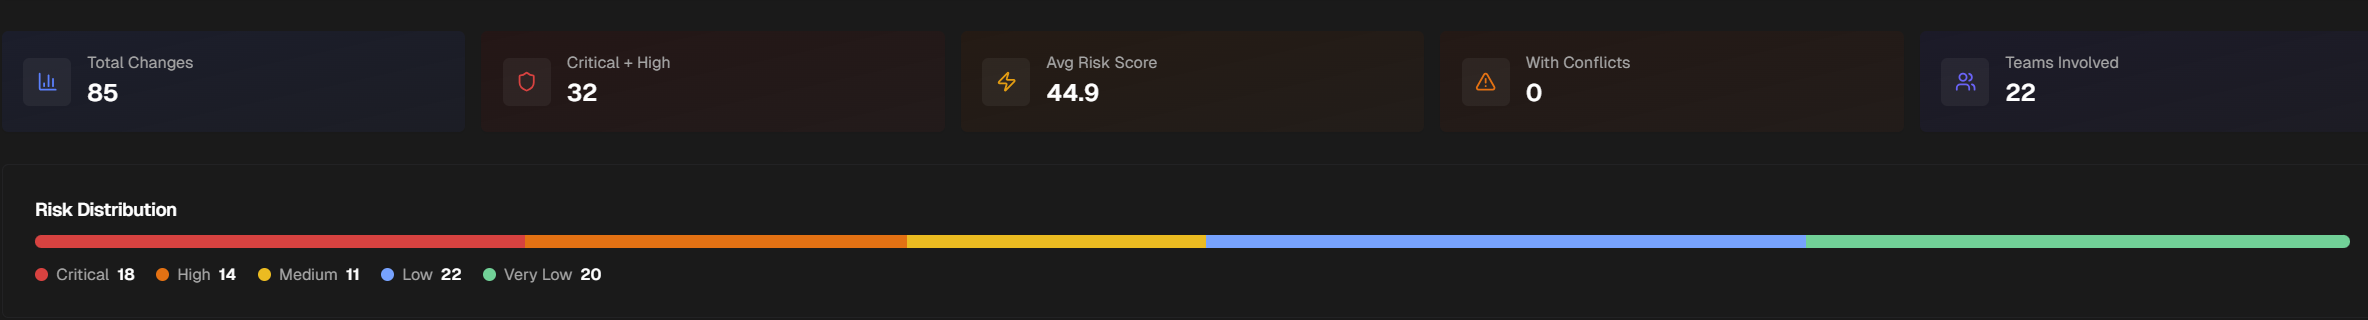
Below the header information is the Executive Summary section. The Executive Summary provides a high-level overview of the changes covered by the report, including the total number of changes scheduled and the risk distribution. The summary includes Key Findings, Cross-Change Patterns, and a CAB Recommendation section.
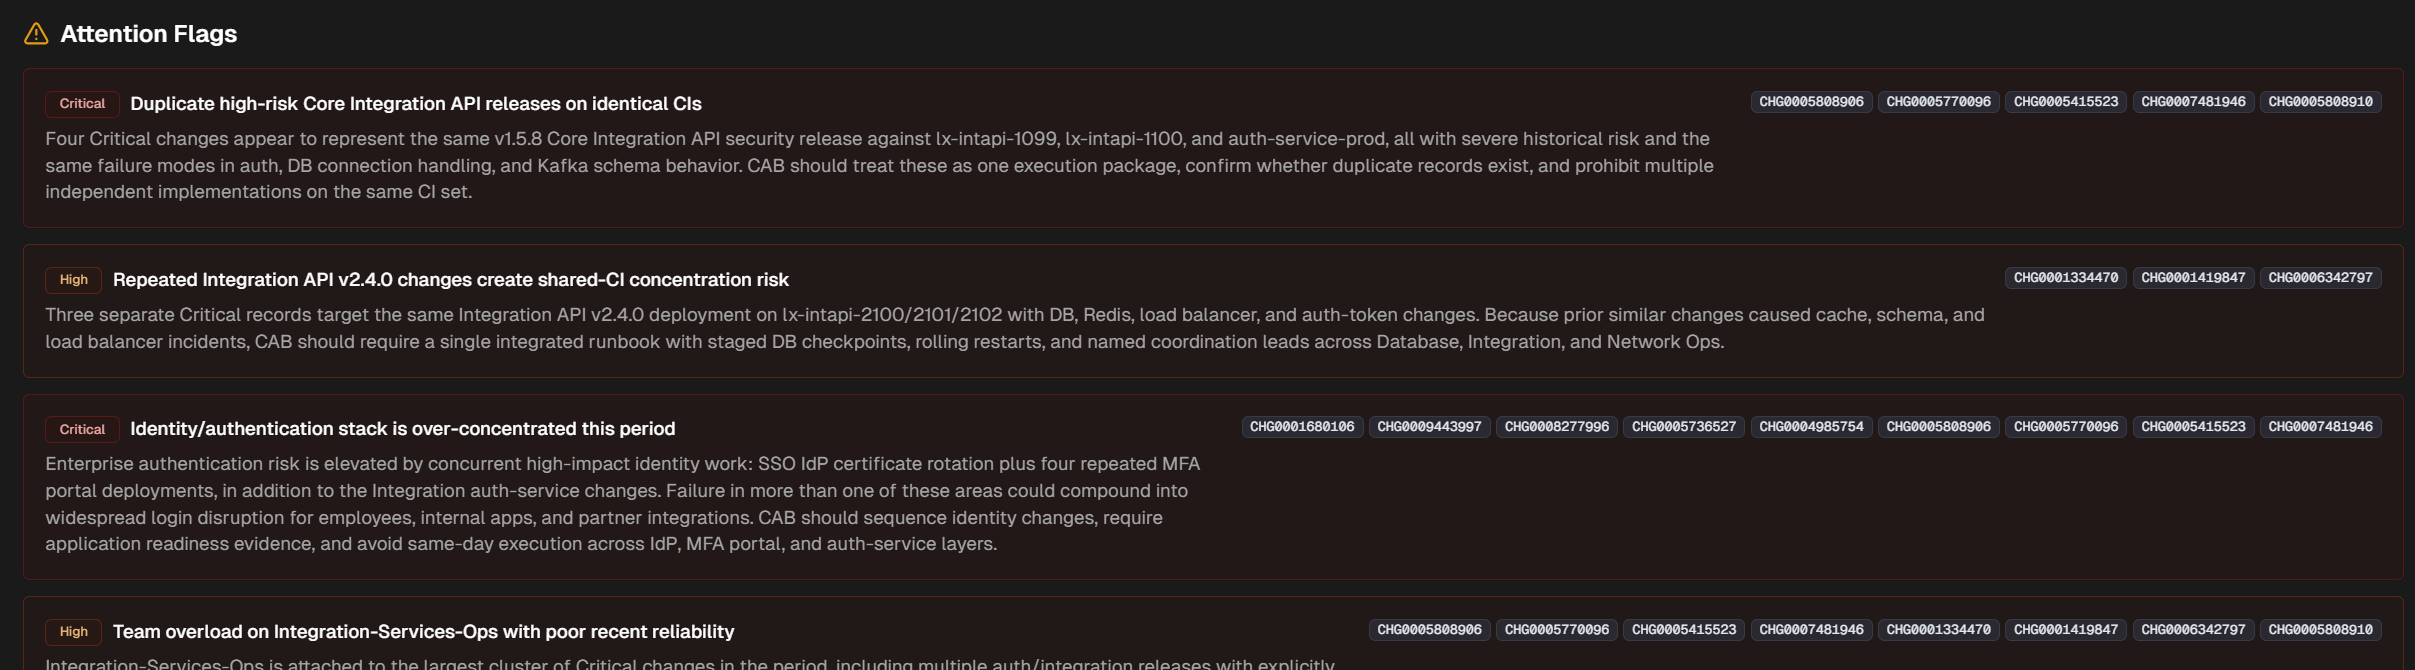
If you generated an enhanced report, the Attention Flags section is available. Attention Flags display risk trends identified in the changes analyzed.
The Risk Distribution section visualizes the breakdown of changes by risk level. The number of changes for each risk level (Critical, High, Medium, Low, and Very Low) appears below the bar.
The Changes Requiring Attention section lists the changes that require CAB review. The Approved Changes section lists changes approved by the CAB.
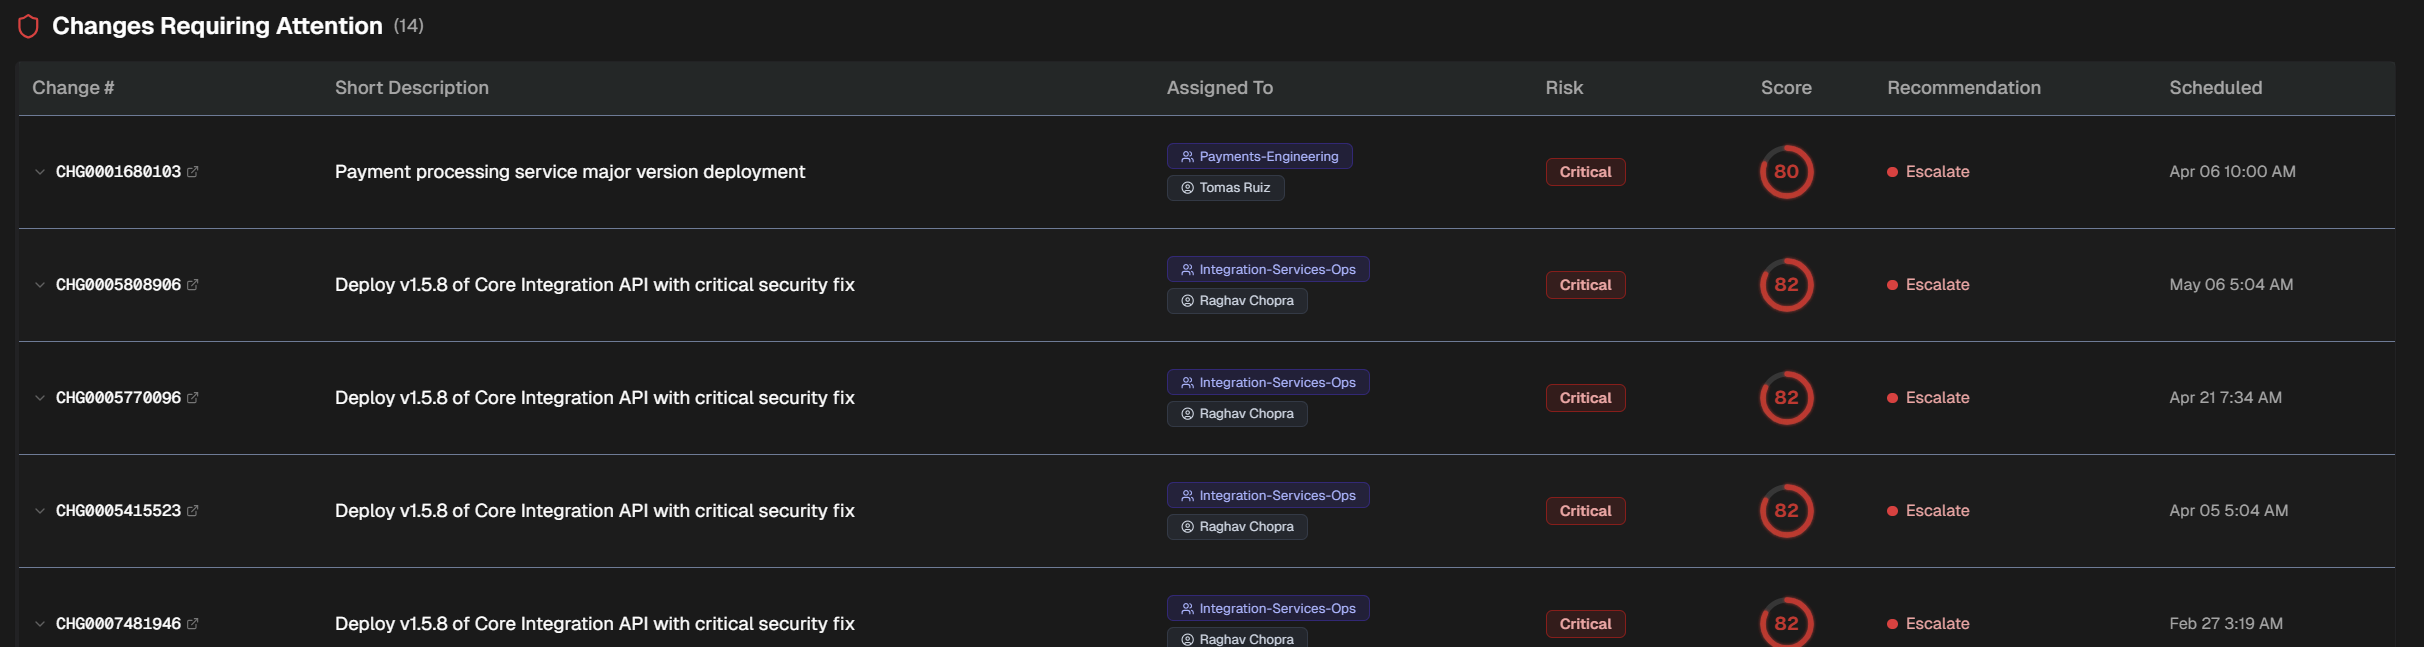
The following basic information is displayed for changes in each section:
Change number
Short description
Assignee
Risk level
Risk score
Recommendation
Scheduled date and time
Click any listed change to view additional details. The following details appear for each listed change:
Short description
Detailed description
ServiceNow link
Assignee
Team
Scheduled date and time
Approval status
Declared risk
Change history
Affected CIs
Affected services
Risk score breakdown
Risk reasoning
Suggested mitigations
CAB talking points
Recommendation
The Retrospective section displays changes from the previous period that caused incidents. Use this information to understand recent change-related incidents and inform CAB decisions about upcoming changes.
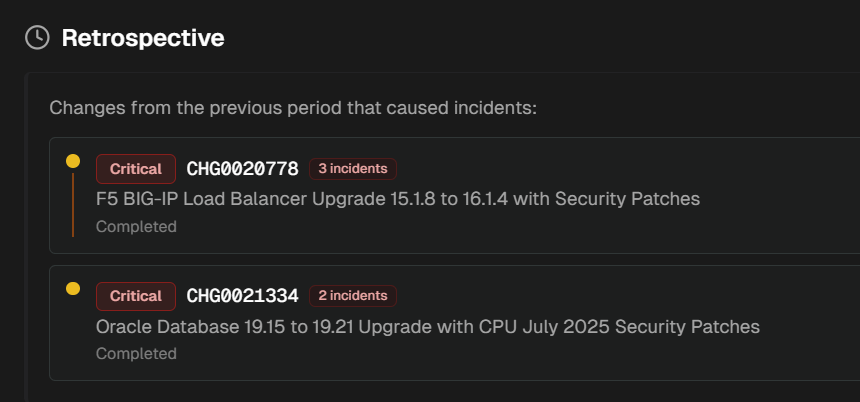
For each change, the following information is displayed:
Risk rating
Change number
Number of incidents caused
Short description
Current state (for example, Scheduled or Closed Complete)