Real-time Health Dashboard
The Health Dashboard provides a near real-time overview of your operational health metrics in a consolidated view. Within the Health Dashboard tab, you can:
See overall service health at a glance.
Understand which services and applications are affected by current incidents.
Visualize business impact to prioritize team efforts.
Focus your teams on incidents affecting critical infrastructure and applications.
The color coding and simple format of the Health Dashboard is designed for a NOC wall or extra monitor display to make passive monitoring of key services easy.
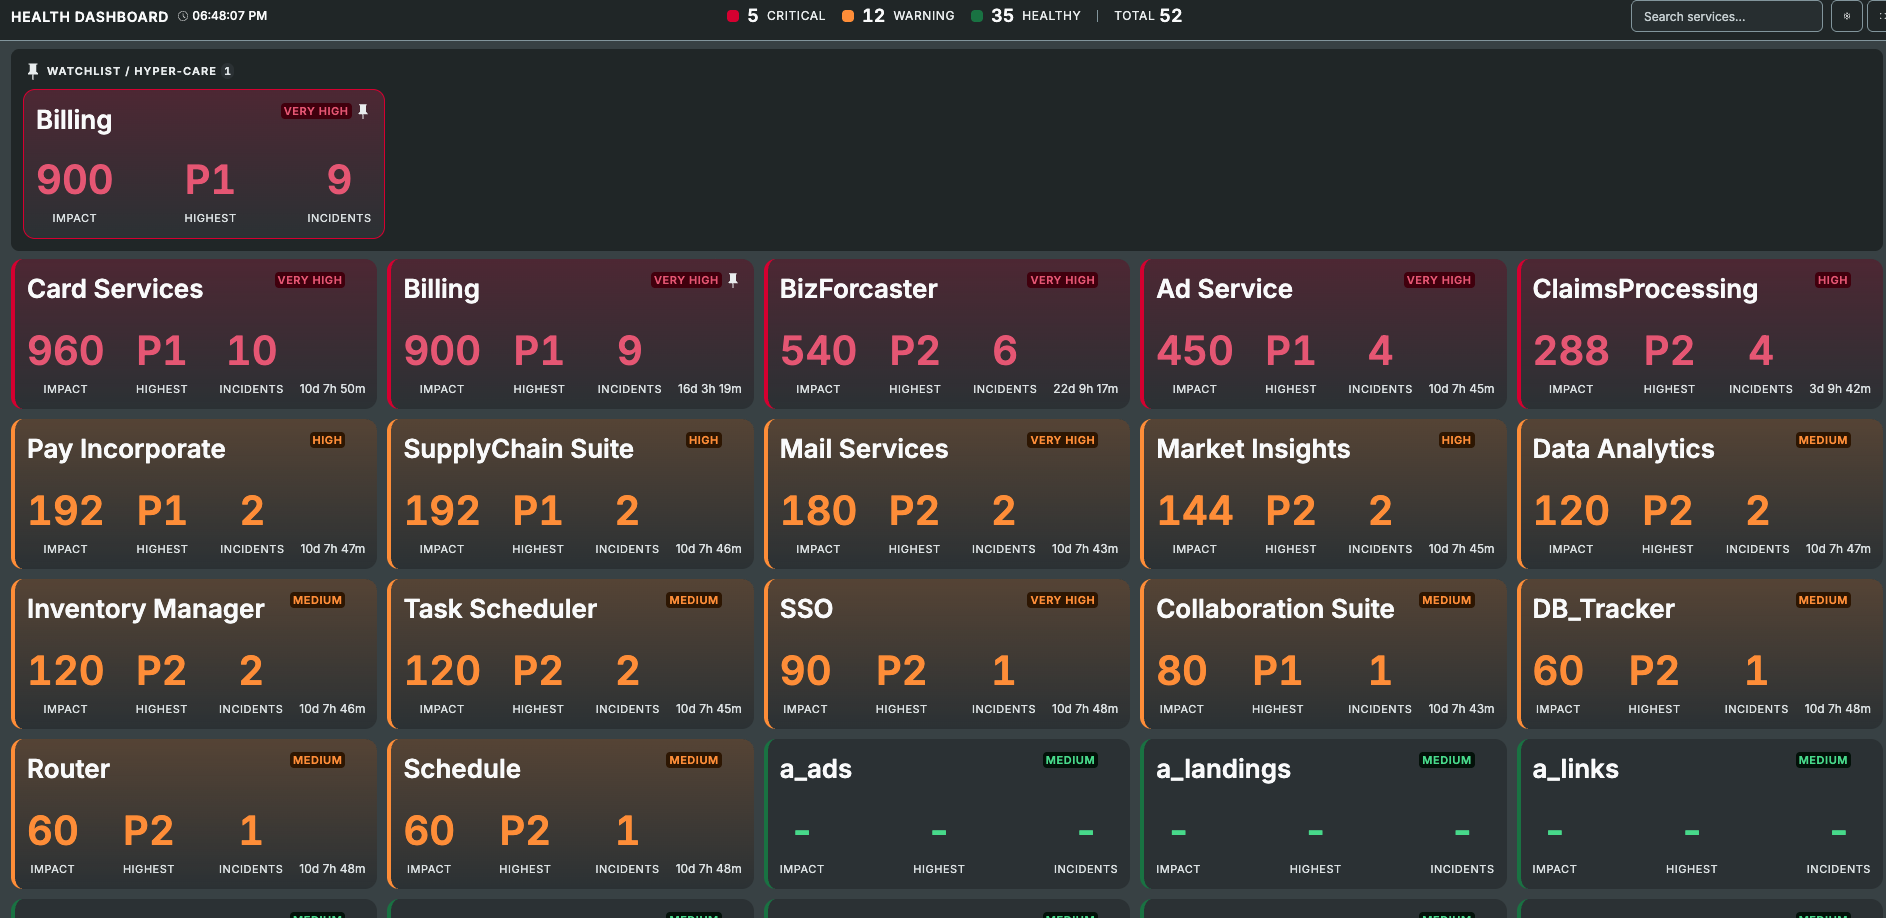
Health Dashboard
Configured services only
The Health Dashboard is configured for services that may have the highest business impact, based on specific incident tags. Which services are visible and how they are escalated is managed directly in your organization's dashboard configuration. See the Manage the Health Dashboard section for details on configuring service settings.
View the Health Dashboard
The Health Dashboard can be accessed from the BigPanda Console Pane. At the top, click the Health Dashboard tab.
At the top of the dashboard is a summary of the total number of affected tracked services, sorted by impact.
Each tracked service appears as a single tile on the dashboard. Tile size is automatically calculated by the number of services in the critical impact state, and the impact state of that specific service.
By default, critical services are sorted to the top of the dashboard, and healthy services are sorted to the bottom. You can configure which risk tiers and priorities are shown on the dashboard, and which order to sort services.
Services can be pinned to a watchlist. Watchlist services always appear at the top of all other tiles. Pins are saved at the user account level.
The data on the dashboard refreshes automatically every 15 seconds. Click the Circle Arrow Refresh button to manually update the data.
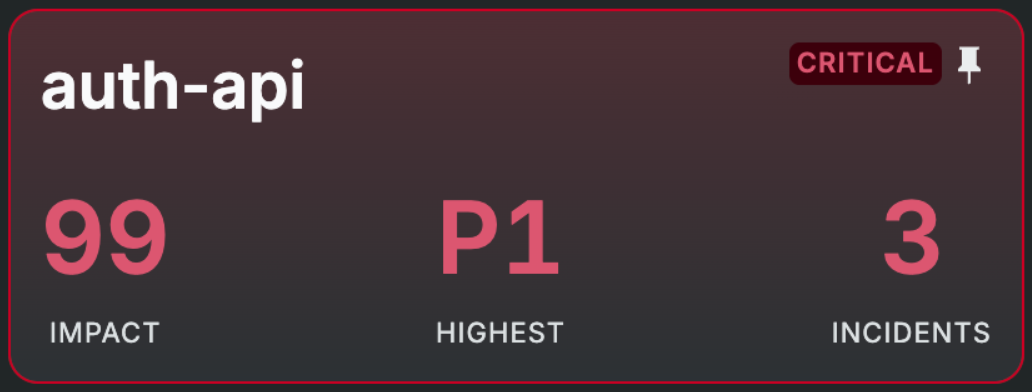
Each tile includes additional information, including:
Service name
Business Risk
Highest associated incident Priority
Number of current incidents associated with the service
Length of time the service has been in the current impact state
Business Impact calculation & color
Tiles are color-coded to represent business impact.
Health impact is calculated by comparing the business risk that a specific service represents, compared against the number and severity of incidents associated with that service.
Red: Services experiencing issues with potentially severe business impact
Orange: Services that may require investigation
Green: Low business impact or no outages
Adjust view settings for the Health Dashboard
The Health Dashboard can be adjusted to better fit the needs of your team. On the top right of the dashboard, click the Settings icon to adjust the view.
View setting | Description |
|---|---|
Configuration settings | Adjust sort type and order, filter visible priorities, risk, and status levels. Filters are saved at the user account level. |
Full screen toggle | Click to switch the Health Dashboard in and out of Full screen view. |
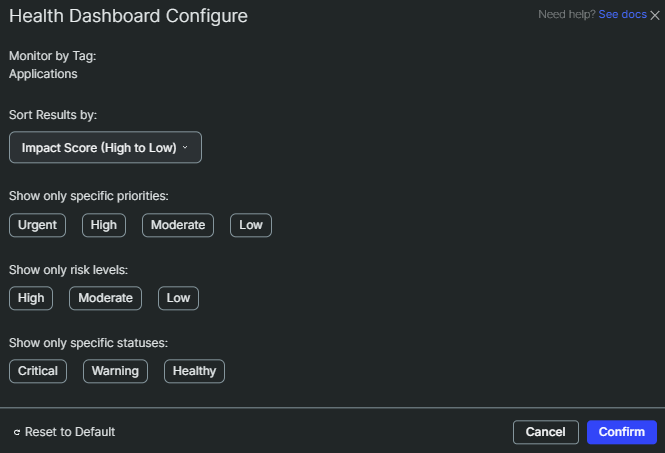
Configure Dashboard View
Services on the watchlist
By default, tiles are sorted first by business impact level and then in the order that services were configured. The watchlist helps your team remain focused on key services even as situations change.
To add a service to the watchlist, hover over the tile and click the Pin icon.
Manage the Health Dashboard
The Health Dashboard is configured specifically to represent business risk and impact for an organization.
To configure or change Health Dashboard settings, navigate to Settings > System preferences > Health Dashboard.
The settings are configured in a 2-tab wizard: Configuration global settings and the Service Configuration service list. Click either tab name to switch to that tab.
Configuration
Configuration settings apply to all watched services for the organization, and all users.
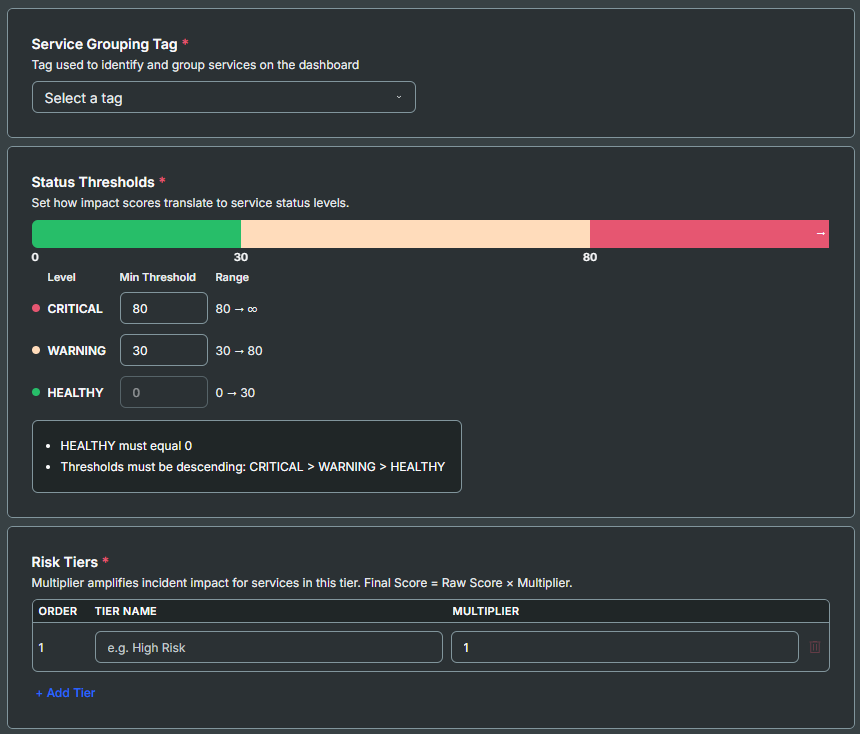
Health Dashboard Configuration
Service Grouping Tag
Select the incident tag that identifies which service an incident belongs to. This tag is used to group incidents by service on the dashboard. Only incidents that match the value of this tag to a Service ID configured in the Service Configuration tab will affect the Health Dashboard. Tag value matches are case-insensitive, but all other characters or spaces must match exactly.
Status Thresholds
Defines how impact scores map to service status colors on the dashboard. Set the minimum score for CRITICAL and WARNING. HEALTHY always starts at 0 and cannot be changed.
Thresholds must be descending:
CRITICAL > WARNING > HEALTHYThe score is additive. There is no maximum cap.
Risk Tiers
Risk tiers classify services by business criticality.
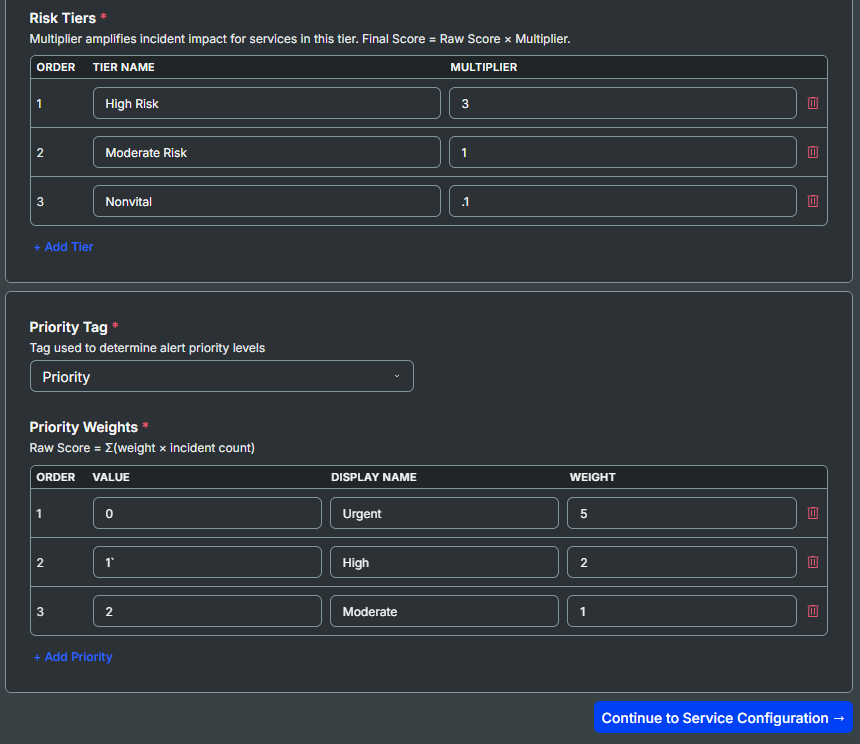
Risk and Priority configuration
Each tier has a multiplier that amplifies the raw impact score for services assigned to that tier:
Final Score = Raw Score × Multiplier
Tier 1 represents services with the highest risk of business impact and should have the highest multiplier. Use + Add Tier to add more tiers. Every service in the Service Configuration tab must be assigned to one of these tiers.
Priority
Priority Tag: The incident tag that determines the priority level of each incident
Priority Weights: Maps each priority value to a numeric weight used in the raw score calculation:
Raw Score = SUM(weight × incident count)
Each row maps a priority tag value to a Display Name and a Weight. Higher-priority incidents should have higher weights. Order 1 = highest priority. If an incident's priority value doesn't match any configured row, it falls back to the lowest order weight.
Example Weights
For example:
A high risk service with 40 current incidents:
Raw score
The total number of incidents matched to that service at each priority, multiplied by the priority weight, makes up the Raw Score
10 Top priority = 10x5 = 50
20 Medium priority = 20x2 = 40
10 Low priority = 10x1 = 10
Total impact
The raw score is then multiplied by the risk tier multiplier to create a total impact score: 90x3 = 270
Dashboard status
A service has highest status if its total impact score is above: 270 > 80 = CRITICAL
A medium risk service with 110 current incidents:
Raw score
The total number of incidents matched to that service at each priority, multiplied by the priority weight, makes up the Raw Score
30 Low priority = 30x1 = 30
80 Lowest priority = 80x.5 = 40
Total impact
The raw score is then multiplied by the risk tier multiplier to create a total impact score: 70x1 = 70
Dashboard status
A service has highest status if its total impact score is above: 80 > 70 > 30 = WARNING
Service Configuration
Identify which services to track, using service tag values, a service name, and risk tier for each service.
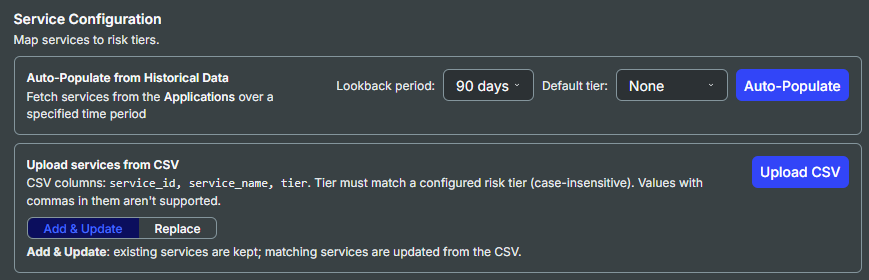
Service Configuration
Auto-Populate allows you to quickly add IDs for all services that recently received at least one incident. The time frame can be adjusted by selecting the Lookback period dropdown. The default is 90 days. Select a Default tier that should be applied to all new services added through auto-population. Tier can be adjusted after auto-population.
Upload services from CSV can be used to bulk upload data from a CSV file with columns for service_id, service_name, and tier. All tiers defined in the CSV must match a configured risk tier. The CSV will be processed case-insensitive, and should not include any values with commas. By default, Add & Update is selected. CSV rows will be added as additional services, or update names and tiers for existing services. To instead replace the services list with only those from the uploaded CSV, select Replace before clicking Upload CSV.
The list will pre-fill from real incident data based on the configured Service Grouping Tag. You can adjust display names, assign tiers, and remove services that should not appear on the dashboard. All services must have a tier assigned. If no display name is defined, the tag value will be used as display name for the service.
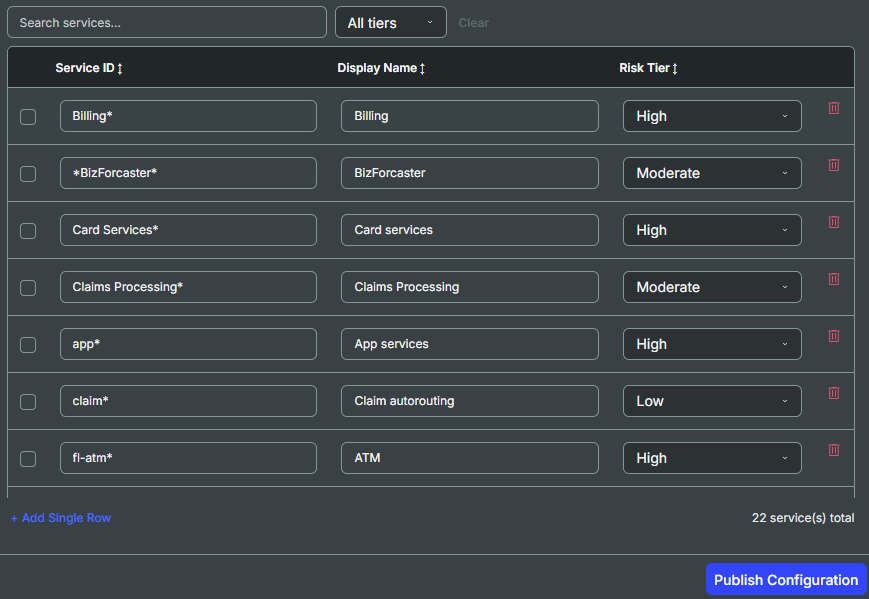
Each row defines a service that will appear as a tile on the dashboard:
Service ID: The exact incident tag value that will be tracked to the service
Display Name: The name shown on the dashboard tile
Risk Tier: The tier assigned to this service
Use + Add Single Row to add services manually. Use the search and tier filter to navigate large lists.
Click Publish Configuration to apply all changes. The configuration will be automatically validated and flag any services with configuration issues.
Configure through API
Health Dashboard configuration fields can be adjusted via API endpoints with the assistance of your account team. Reach out to your account team for details on using the Health Dashboard API.
Impact Score Fields
Field Name | Description |
|---|---|
organization_name | Name of the organization. API Key must have permissions for the specified organization. |
incident_tags | Incident tag where the values represent the services to track. |
impact_score | Calculation rules that affect visualized impact and service ordering. |
business_risk | Risk levels for mapping service risk and service grouping. By default, there are 4 levels of business risk, with 1 representing the highest impact, and 4 representing a lower impact. The display_name for each risk level can be configured individually. |
services | List of all services that can possibly appear on the dashboard. Each service must have:
|
Health impact is calculated by comparing the business risk that a specific service represents, compared against the number and severity of incidents associated with that service.
Field name | Description |
|---|---|
status_thresholds | Risk calculations and visual settings for the 3 severity levels.
|
business_risk_multiplier | Modifier to adjust degree of escalation for services with higher business risks. |
priority weight | Weighting for incident priorities when calculating impact. |
  "impact_score": {
    "status_thresholds": [
      {
        "display_name": "CRITICAL",
        "min_threshold": 80.0
      },
      {
        "display_name": "WARNING",
        "min_threshold": 30.0
      },
      {
        "display_name": "HEALTHY",
        "min_threshold": 0.0
      }
    ],
    "business_risk_multiplier": [
      {
        "order": 1,
        "multiplier": 1.5
      },
      {
        "order": 2,
        "multiplier": 1.2
      },
      {
        "order": 3,
        "multiplier": 1.0
      }
    ],
    "priority_weight": [
      {
        "order": 1,
        "weight": 80.0
      },
      {
        "order": 2,
        "weight": 60.0
      },
      {
        "order": 3,
        "weight": 20.0
      },
      {
        "order": 4,
        "weight": 10.0
      },
      {
        "order": 5,
        "weight": 5.0
      }
    ]
  },
  "business_risk": [
    {
      "display_name": "Tier 1",
      "order": 1
    },
    {
      "display_name": "Tier 2",
      "order": 2
    },
    {
      "display_name": "Tier 3",
      "order": 3
    },
    {
      "display_name": "Tier 4",
      "order": 4
    }